 Will Trump’s Tariffs Tank China’s 5 Percent Growth?
(Yicai) April 22 -- China’s National Bureau of Statistics recently released its National Accounts for the first quarter of 2025. The news was good. The 5.4 percent year-over-year growth reported beat the expectations of the Chief Economists surveyed by the Yicai Research Institute (5.1 percent).
With the sizable tariffs announced by the Trump Administration going into effect in April, there will only be a short celebration for the Q1 outturn.
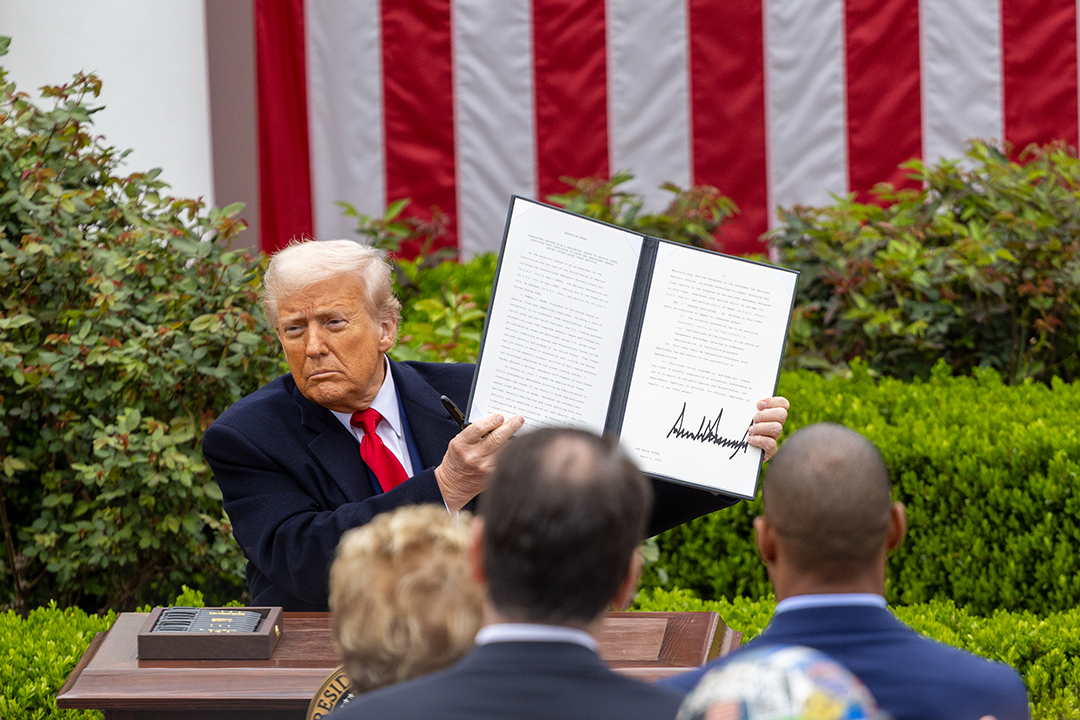
The amount of the tariffs and the number of products eligible for exemption changes from day to day. According to a recent fact sheet from the White House, the tariffs imposed on China include a 125 percent reciprocal tariff, a 20 percent tariff to address the fentanyl crisis, and the Section 301 tariffs on specific goods of between 7.5 and 100 percent.
China has responded with tariffs of its own of roughly similar magnitude.
This sort of massive tariff war will undoubtedly disrupt the Chinese economy. To illustrate, I rely on simulations performed by economists at the Peterson Institute for International Economics. In October, they estimated the effect of the US imposing a 60 percent tariff on China and a 10 percent tariff on all other countries and assumed that China would fully retaliate.
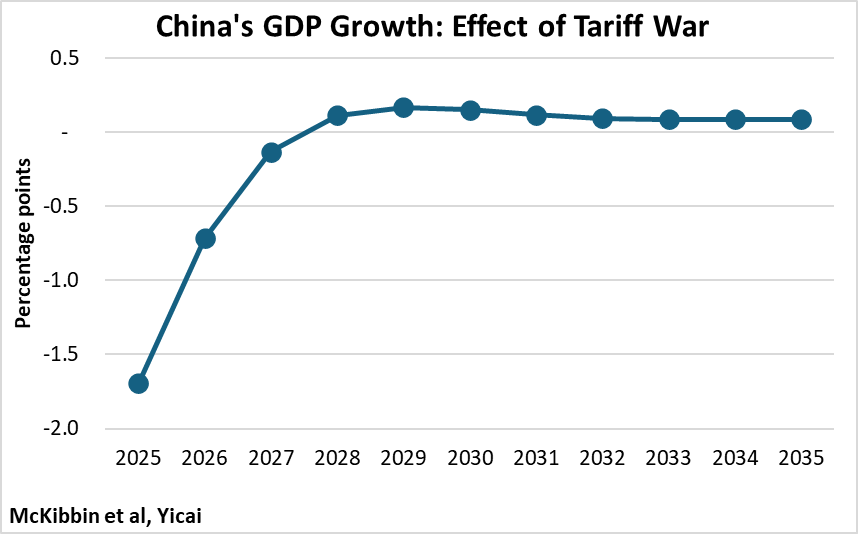
I assume that their model is linear and I have increased the effect for tariffs of 125 percent. This exercise suggests that the tariff war will reduce China’s GDP growth rate by 1.7 percentage points in 2025 and by an additional 0.7 percentage points in 2026 (Figure 1). If maintained, the tariffs would permanently reduce the level of China’s GDP by 1.6 percentage points.
Figure 1
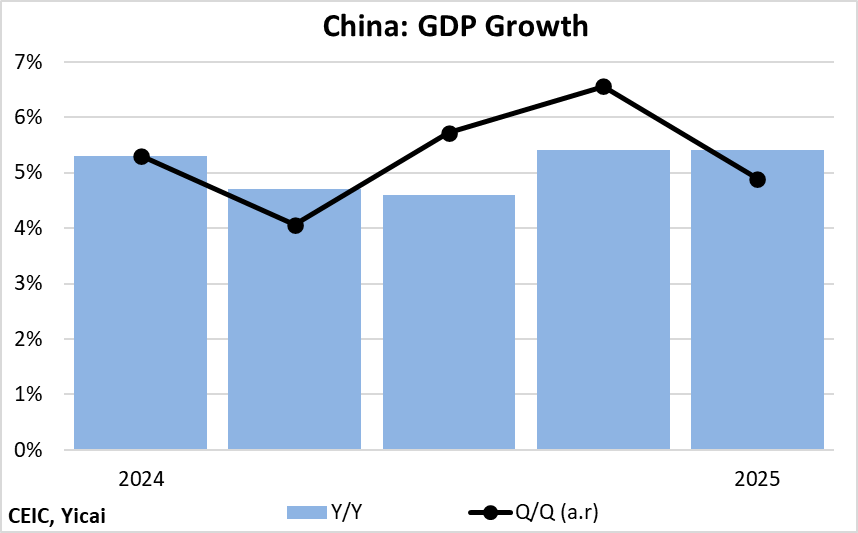
Luckily, the tariffs are being imposed at a time when the Chinese economy is fairly strong. At 5.4 percent, year-over-year growth in Q1 exceeded the government’s 5 percent target for 2025. On a quarter-over-quarter basis, growth dipped to 4.9 percent at annual rates in Q1 (Figure 2). However, this followed an exceptionally strong fourth quarter (6.6 percent at annual rates). Averaging over 2024Q3-2025Q1, quarterly growth has been a robust 5.7 percent.
Figure 2
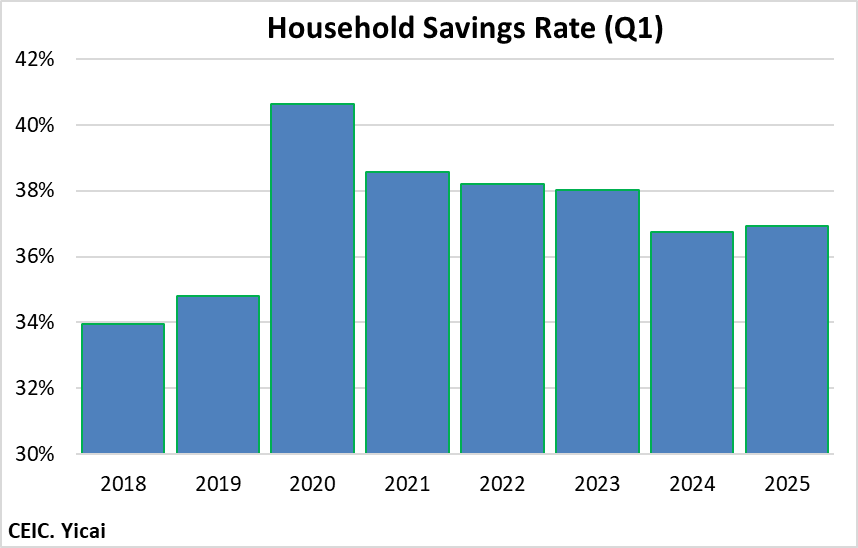
Despite President Trump’s threat of imposing significant tariffs on China since his election in November, Chinese household confidence has remained fairly high. Precautionary savings rose by a hair from their 2024Q1 level. They remain well below their 2020Q1 peak albeit still somewhat higher than pre-pandemic levels (Figure 3).
Figure 3
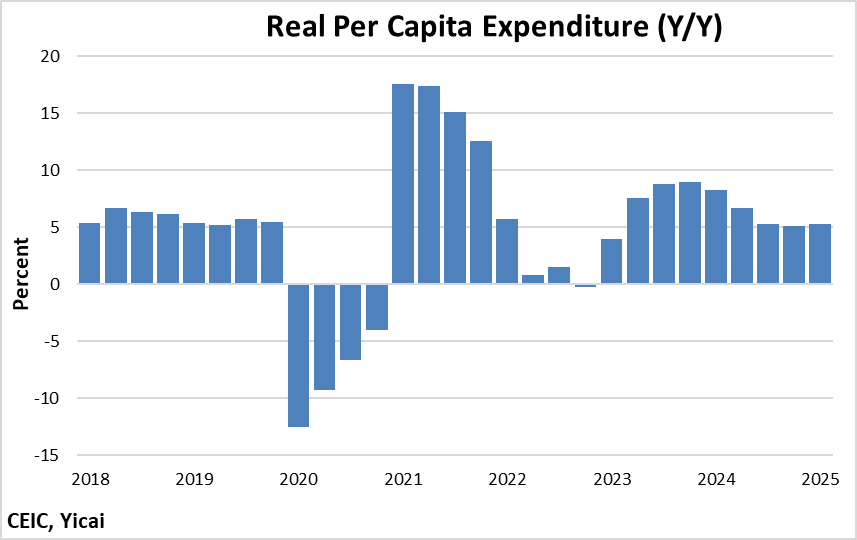
Consumption has stabilized following the volatility of the last four years (Figure 4). Real per capita expenditure growth was 5.3 percent in Q1, just slightly below pre-pandemic rates. Indeed, in cities, spending accelerated to 4.8 percent, in real terms, from 4.3 percent over 2018-19.
Figure 4
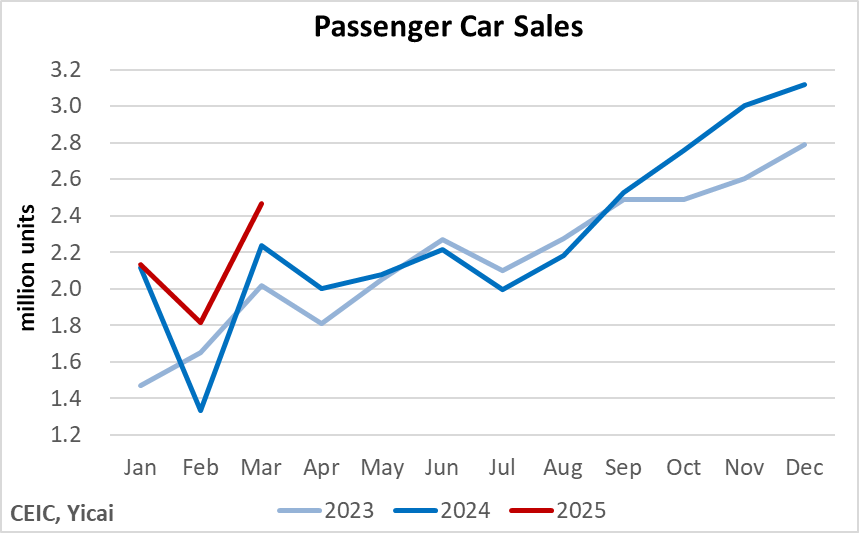
Autos, which are a big ticket item, well illustrate the rebound in consumption. Passenger car sales in the first quarter were up 13 percent from a year earlier (Figure 5). Moreover, they set a new record for first-quarter sales, exceeding 2018Q1’s level by 5 percent.
Figure 5
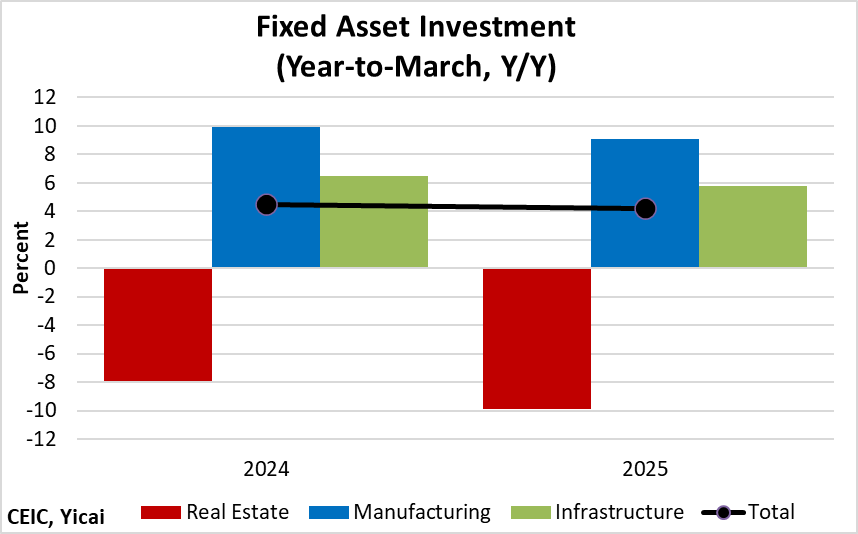
The property market continues to drag fixed asset investment down. Investment in real estate fell by 10 percent in Q1, an even steeper fall than the 8 percent decline in 2024Q1 (Figure 6).
Investment in manufacturing remains a bright spot. Even though growth dipped from 10 percent in 2024Q1 to 9 percent this year, it remains about double the rate recorded in the first quarters of 2018 and 2019. Building state-of-the-art factories is a sure way to increase productivity and, ultimately, raise incomes.
Figure 6
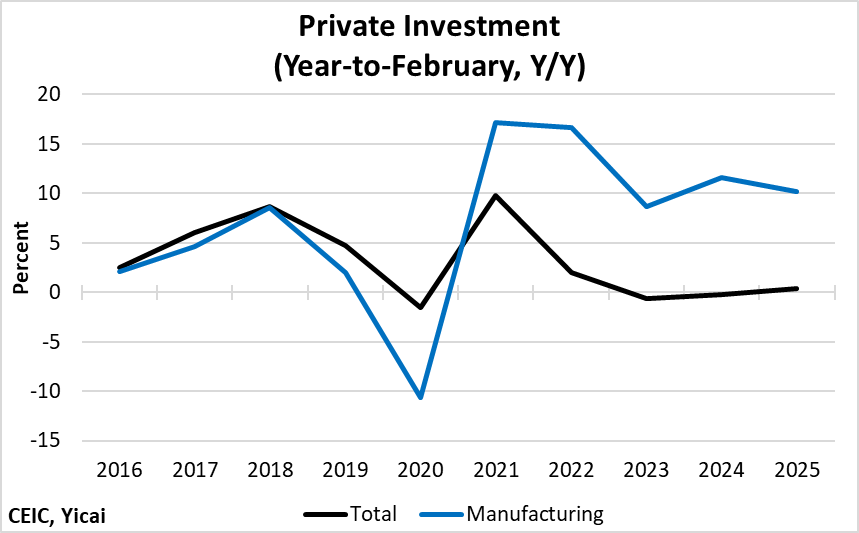
Real estate is a particularly important sector for private investment. Thus, it is not surprising that overall private investment has slowed to a crawl. Nevertheless, the data through February show that private entrepreneurs in manufacturing remain optimistic and have been investing at much higher rates than before the pandemic (Figure 7).
Figure 7
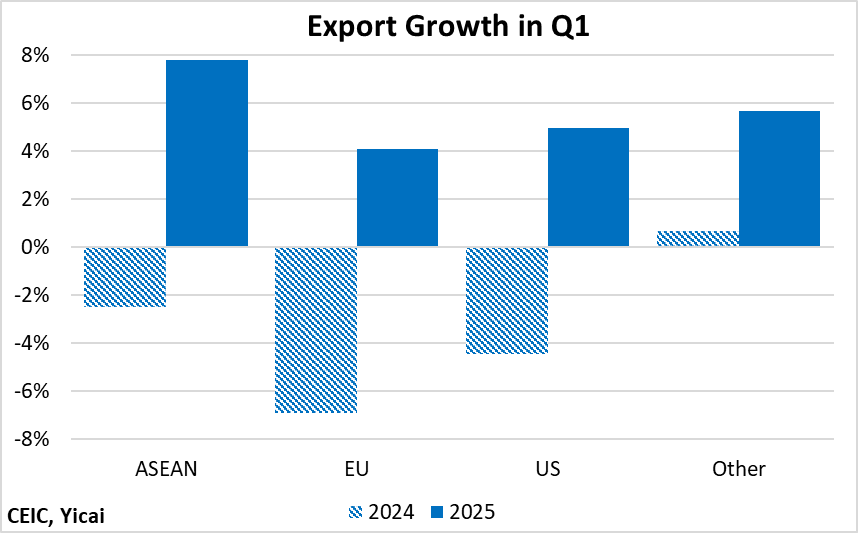
After a strong 2024, China’s exports continued to grow rapidly in Q1.
Some analysts have suggested that this was the result of US customers stocking up on Chinese products in advance of the tariffs being imposed. However, the data for Q1 show a marked turnaround in export growth across all major destinations (Figure 8), suggesting that stocking up probably only had a limited impact. Note that the ASEAN, the EU and the US each account for roughly 15 percent of China’s exports while all other countries represent the remaining 55 percent.
Figure 8
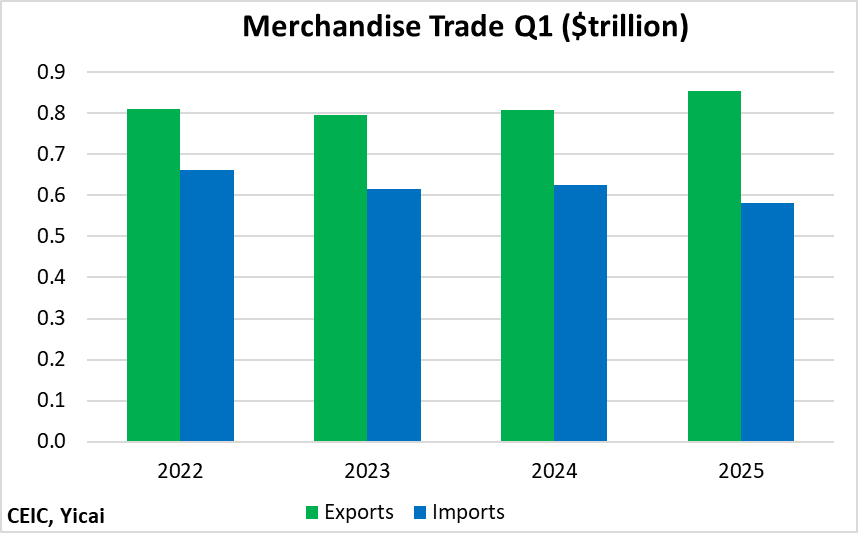
The trade surplus was wider in the first quarter this year compared to the same period in previous years because of rapid export growth and a drop in imports (Figure 9).
Figure 9
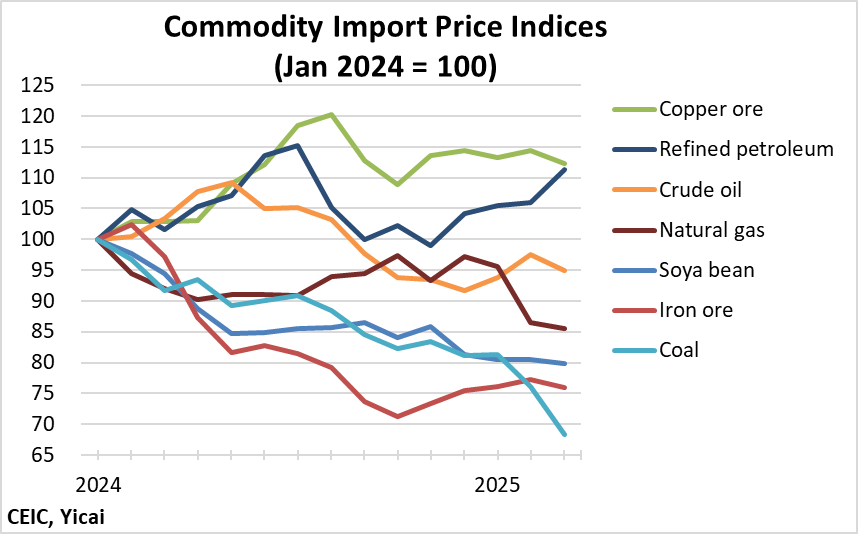
Much of the weakness in imports comes from falling commodity prices.
The 7 commodities whose prices are shown in Figure 10 represented more than a quarter of China’s imports in Q1. While the prices of copper ore and refined petroleum rose, on a weighted-average basis, the prices of these 7 imports fell by 9 percent from 2024Q1 levels.
In addition, the greening of the Chinese economy is reducing the demand for fossil fuels while the weakness in the property market makes iron ore imports less attractive.
Figure 10
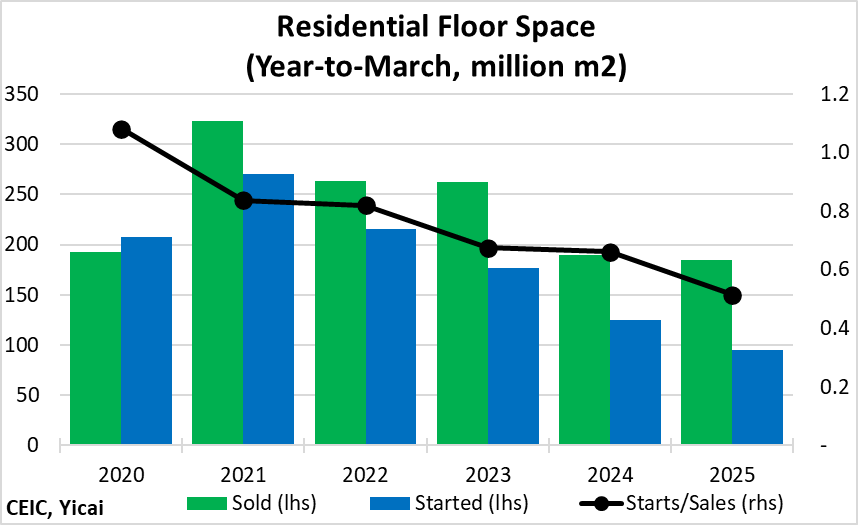
There are tentative signs that the property market is beginning to bottom out.
In the first quarter, the volume of new home sales only fell by 2 percent from a year earlier. In 2024Q1, the decline had been 28 percent.
Despite this improvement, developers have been unwilling (or unable) to increase the supply of new homes. In the first quarter, the volume of new home starts was down 24 percent, which is only a marginal improvement from the 29 percent decline in 2024Q1.
It is reasonable for starts to follow sales with a lag. There is an inventory of unsold homes that has to be worked through. Nevertheless, new home starts are at a very low level given sales. In the first quarter, the starts-to-sales ratio was only 0.5 (Figure 11). This compares to a ratio of 1.0 over 2016-19.
Figure 11
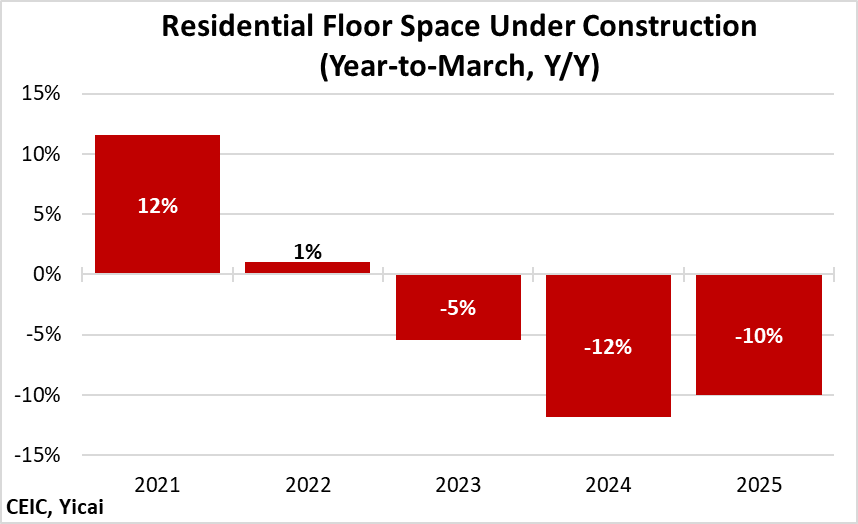
The volume of floor space under construction is the broadest measure of residential construction activity. In the first quarter, it was down 10 percent from a year earlier (Figure 12). This was a modest improvement from the 12 percent drop in 2024Q1.
By declining at a slower rate, the property market is making a larger (less negative) contribution to GDP growth than it did last year. Given the importance of real estate to the Chinese economy, continued improvement could offer an important offset to the tariffs’ contractionary impact.
Figure 12
Fiscal policy will be another important factor in mitigating the effect of the tariffs.
My reading of the budget document suggests that the government is planning for an adjusted general government deficit of 8.8 percent of GDP. In 2024, the actual adjusted general government deficit was 6.5 percent of GDP (Figure 13). The difference, 2.3 percent of GDP, represents the budgeted fiscal stimulus.
Figure 13
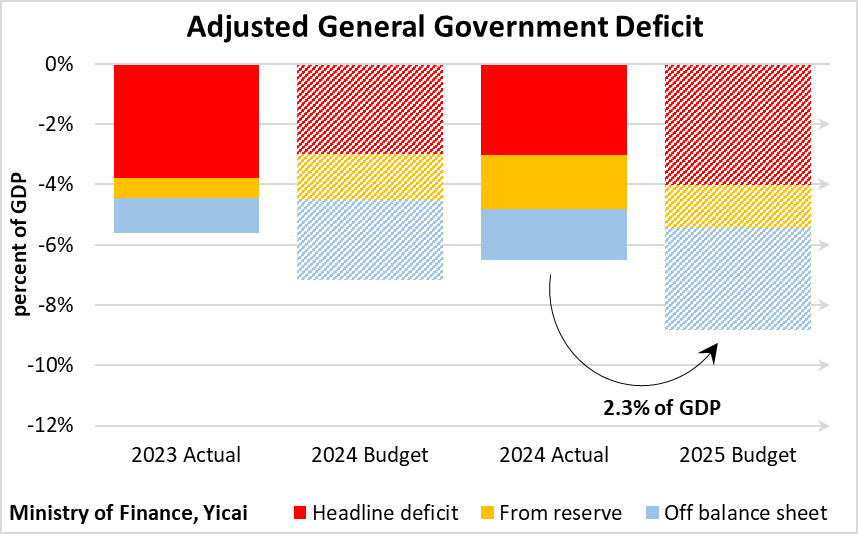
Chinese policymakers, in anticipating the Trump Administration’s tariffs, were proactive in budgeting more than enough fiscal stimulus to protect the economy. Now implementation is key.
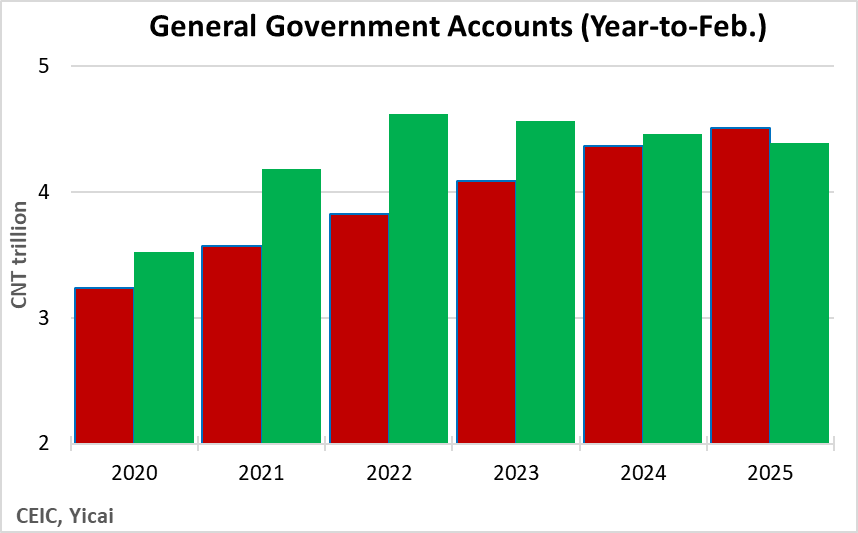
We have fiscal data through February on a subset of the adjusted general government accounts – headline government revenue and expenses. The headline deficit was budgeted to increase by 1 percent of GDP this year. Figure 14 shows that in the year-to-February, the government typically runs a surplus. This year it is running a small deficit. The value of the swing in the balance between 2024 and 2025 is 0.9 percent of GDP (at annual rates) or pretty close to the budgeted support.
Figure 14
To sum up, the Trump Administration’s tariffs will be economically painful for all countries, including the US. But I do not think that they will tank China’s chances of achieving 5 percent growth this year.
If we assume the tariffs will subtract 1.7 percentage points from growth, then there are three factors that offer the economy significant resilience.
First, the economy enters the year with good momentum. The short-run trend for GDP growth is 5.7 percent, which gives the target something of a pad.
Second, the government has budgeted 2.3 percent of GDP in fiscal support. This by, itself, should be enough to offset the negative effects of the tariffs. From what we can see, the early data suggest smooth implementation of the fiscal plan.
Third, the property market appears to be bottoming out. While it may not grow in 2025, residential real estate activity will likely support the economy by being less of a drag.
 Mark KrugerBased in Shanghai, Mark Kruger holds Senior Fellow appointments at the Yicai Research Institute, the Centre for International Governance Innovation and University of Alberta’s China Institute. Between 2020 and 2023, Mark was the Opinion Editor at Yicai Global. Previously, he had a 30-year career with the Bank of Canada in the course of which he served as a Senior Advisor to the Canadian Executive Director at the IMF and the head of the Economic and Financial Section of the Canadian Embassy in Beijing.