 Has China’s Property Market Bottomed Out?
(Yicai) May 20 -- The data recently released by the National Bureau of Statistics suggest that, after three years of precipitous decline, China’s residential property market may be bottoming out.
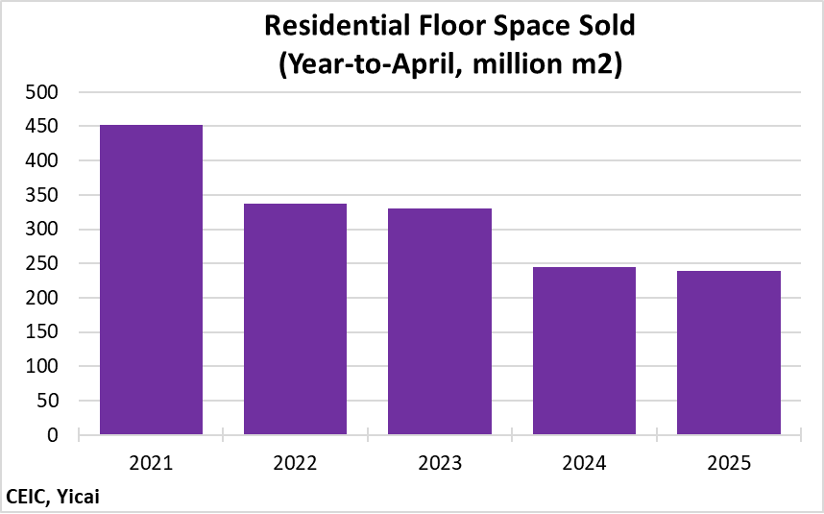
So far this year, the volume of new residential sales is down 3 percent. This is a marked improvement from the 26 percent decline in the first four months of 2024 (Figure 1). Nevertheless, residential sales remain at a very low level, down 47 percent from their 2021 peak and 15 percent lower than their 2010-2020 average.
Figure 1
A number of factors are working to slow the fall in home sales.
First, housing has become more affordable. Between 2021Q1 and 2025Q1, urban disposable incomes rose by 20 percent (Figure 2). The prices of new homes declined by 8 percent over the same period, leading to a significant improvement in the new home-to-income ratio.
Figure 2
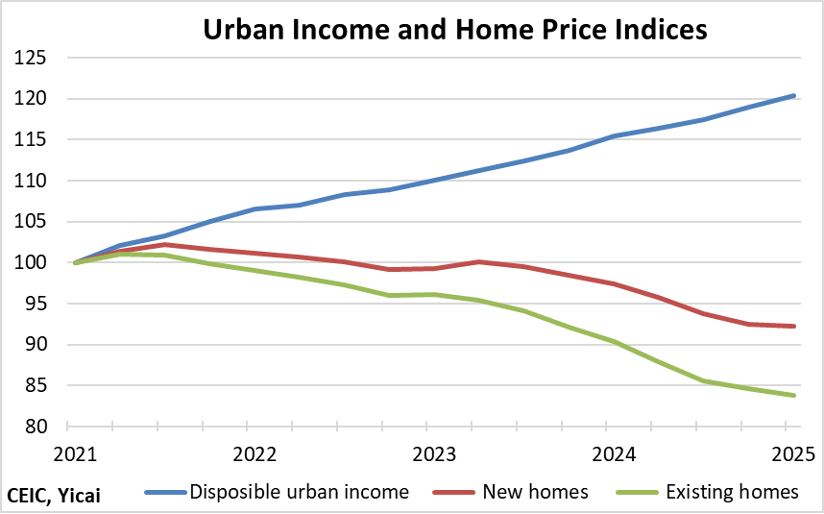
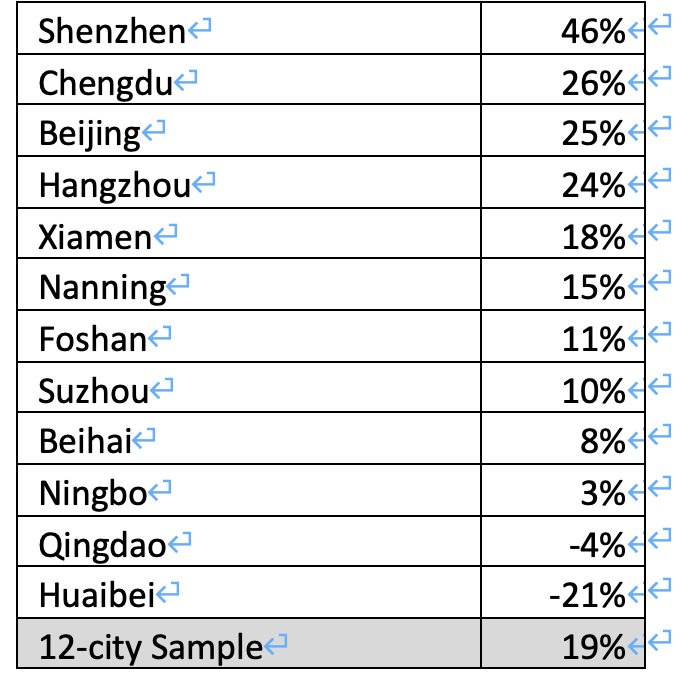
Figure 2 also shows that the prices of existing homes fell twice as rapidly as those of new homes. This is one factor underpinning what appears to be a strong rebound in existing home purchases. While it is difficult to find nationally representative data on existing home sales, the sample of 12 cities for which I have timely and consistent data show a 19 percent increase in units sold in the first four months of this year, compared to the same period in 2024 (Table 1).
Table 1
Existing Home Sales (units)
Year-to-April (Y/Y)
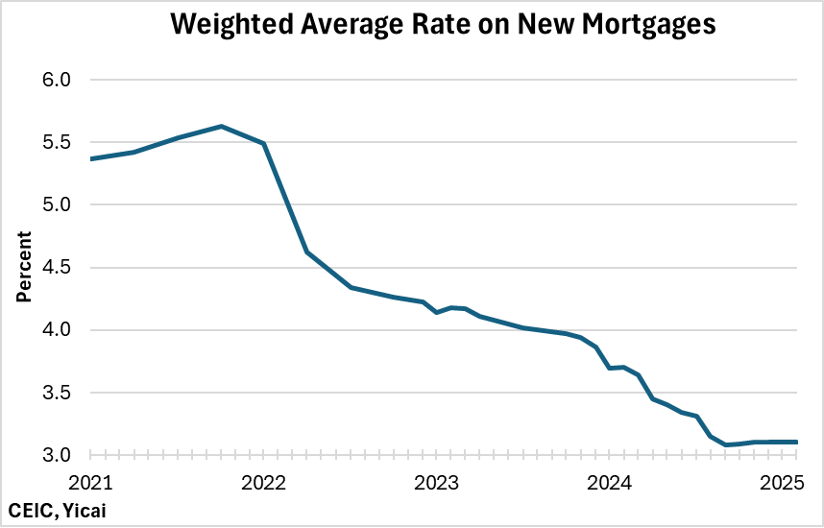
A second factor supporting new home sales is the decline in mortgage rates. Banks were charging 5.6 percent on new mortgages in mid-2021 when the market was at its peak (Figure 3). Rates have since fallen by 2.5 percentage points. Lower borrowing costs are also contributing to improving new home affordability.
Figure 3
Third, more liberal macroprudential policy is encouraging home sales. Beginning in 2010, many Chinese cities implemented limits on the number of investment properties a family could own. Moreover, they required that new residents from other cities pay local taxes for specific periods of time before they were eligible to purchase housing. These measures were designed to curb speculative buying and stabilize prices. Since 2024, most cities have relaxed or eliminated these rules and have broadened the market for new and existing homes.
Over the years, the Chinese authorities have tried to insulate the financial system from the risks posed by highly-leveraged developers. For example, there are limits on the amount of bank loans developers can obtain. As a result, they turned to the home buyers themselves as a major source of funding. It is not uncommon for buyers to give the developer 100 percent of the value of their home to fund its construction. With many developers in precarious circumstances, it is no wonder that prospective buyers no longer feel comfortable fronting construction costs and have exited the market.
To manage this problem, various municipal governments have been piloting programs to incentivize the sales of completed homes. For example, the city of Xiong’an, which lies close to Beijing, has mandated that all new homes must be built before they can be sold. Nevertheless, because it is difficult for developers to raise finance, the cash-in-advance model will continue to predominate. Exploring ways to safeguard homebuyers’ funds, for example, through escrow accounts, would be useful in helping to restore confidence while maintaining this important funding channel.
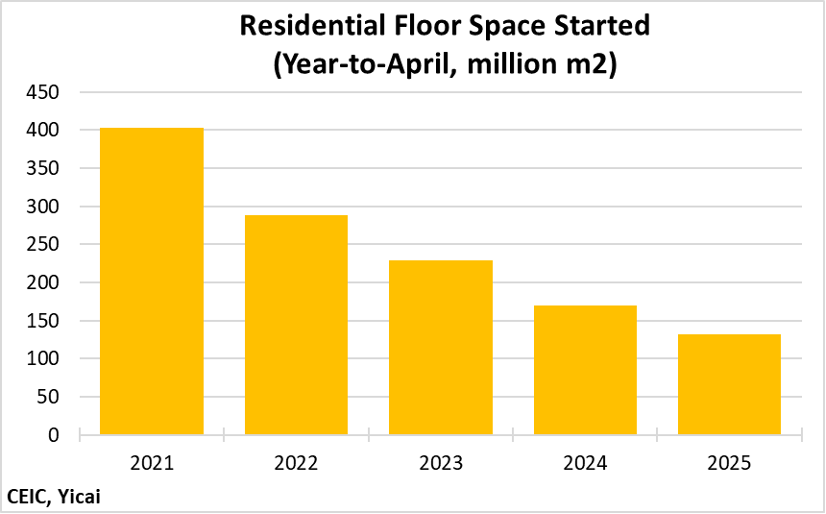
While the sales of newly constructed homes have begun to stabilize, housing starts continue to fall. In the first four months of the year, starts are down 23 percent year-over-year. This is just a minor improvement over the 26 percent decline recorded over January to April 2024 (Figure 4). At 132 million square meters, starts to date are down 67 percent from the first four months of 2021 and 64 percent from their 2010-20 average.
Figure 4
Construction activity is being held back by the high level of inventories. In April, the volume of vacant residential housing awaiting sale was the equivalent of 6.2 months of sales (Figure 5). This is more than double the historical average. With sales now outpacing new construction, inventories have likely peaked, although they will remain very high for some time.
Figure 5

While the construction data remain depressing, there are some hopeful signs that the worst may be over.
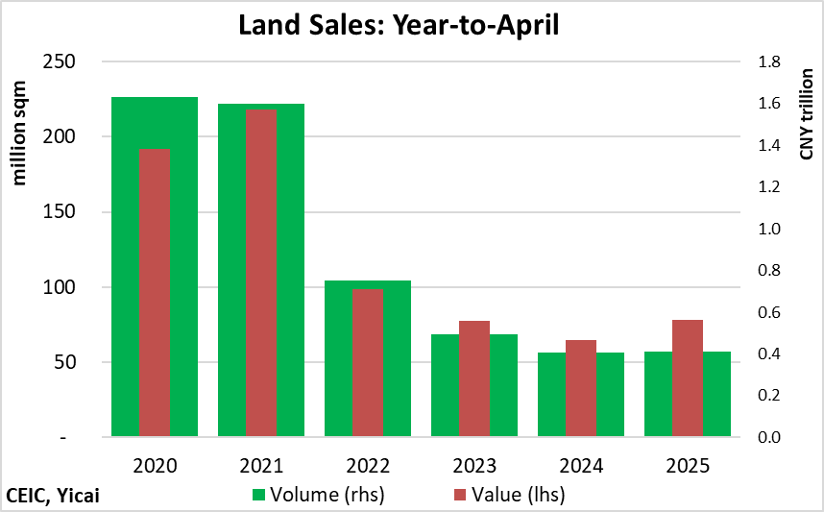
Developers are spending more on buying land for residential construction. In the first four months of the year, the value of land purchased by developers was up 21 percent from the same period in 2024 (Figure 6). Since the volume of land purchased was only up 2 percent, it appears that developers plan to concentrate their activity in high-value areas, likely in the biggest cities.
Figure 6
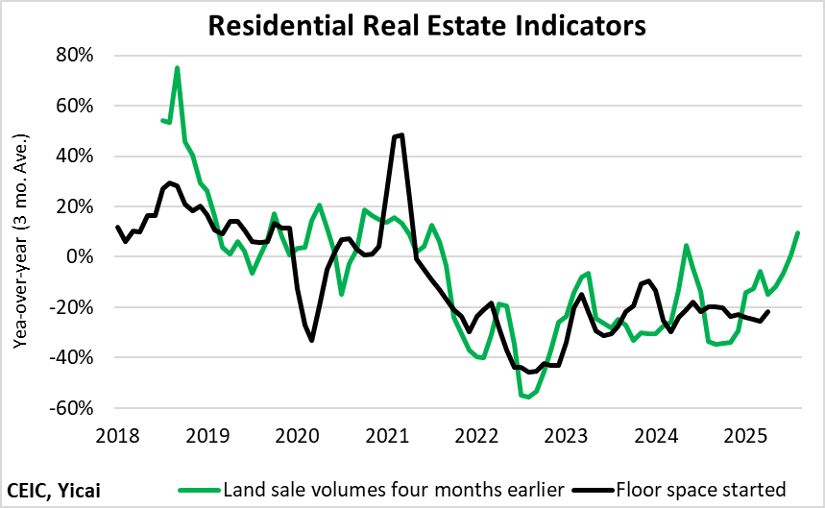
In recent years, a rise in land sales today has been broadly correlated with an increase in housing starts four months later (Figure 7). If this historical relationship holds, we should see a significant improvement in housing starts in the third quarter.
Figure 7
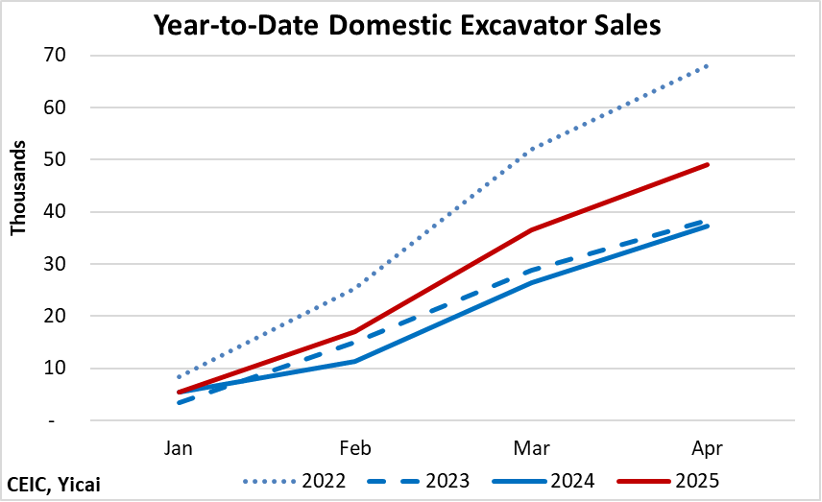
Another promising indicator is the domestic sale of excavators. While excavators are used for infrastructure investments as well as new home construction, I expect that housing accounts for much of the short-term volatility in sales. In any event, domestic excavator sales in the first four months are up by about one-third from their levels in 2023 and 2024 although they remain 28 percent below what we saw in 2022.
Figure 8
The recovery of housing starts will depend on the extent to which the very high inventories weigh on developers’ plans. The Budget Document states that local governments will be allowed to use the funds raised from the sale of special purpose bonds (CNY 4.4 trillion) to redeem idle land and turn vacant homes into subsidized housing. This could reduce inventories and catalyze both construction and home buying.
In the first four months of the year, 1.8 square meters of new residential floor space were sold for every square meter of new construction. The imbalance between sales and construction should help to clear inventories and lead to a rise in prices.
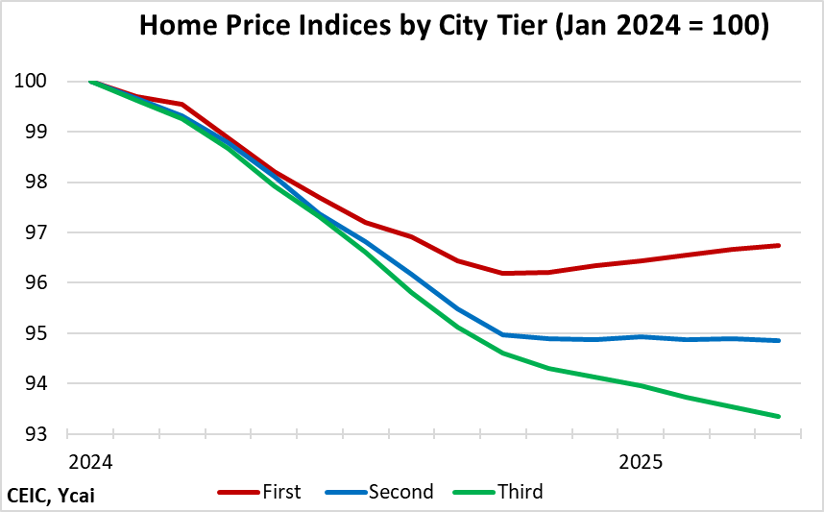
Indeed, new home prices in first- and second-tier cities stabilized last November, with the former rising gradually (Figure 9). While prices in the much more numerous third-tier cities continue to fall, their average rate of decline since November (0.2 percent per month) has been more gradual than over January to October (0.6 percent per month).
Figure 9
We’ve seen false starts in the property market before. The rate of decline of sales narrowed significantly in early 2023, home price declines moderated and starts seemed to pick up later that year. But that rebound was short lived.
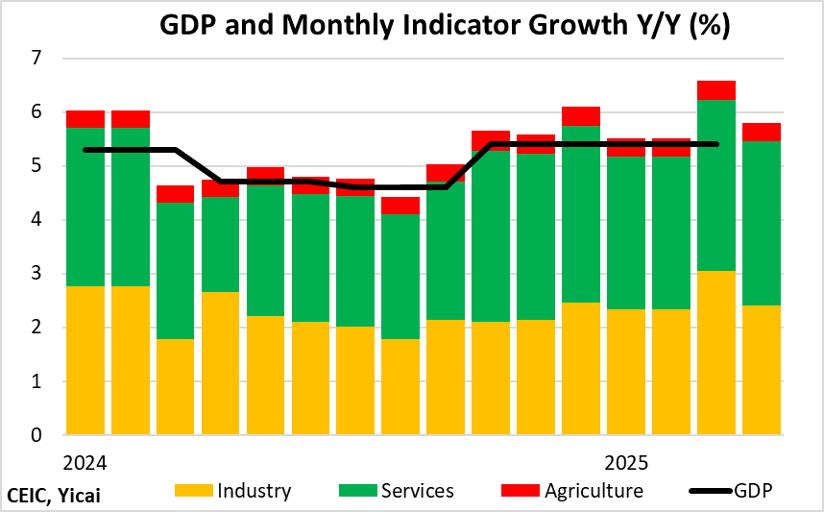
This time, the persistence of the pick up in sales seems more solid. Moreover, the strength in land sales bodes well for starts later this year. While high inventories remain a risk, the property market should benefit from buoyant macroeconomic conditions. Our monthly GDP indicator suggests that, after a strong first quarter, the economy grew in excess of 5½ percent in April (Figure 10).
On many fronts, the current economic outlook is uncommonly uncertain. Thus, the data bear careful monitoring.
Figure 10
 Mark KrugerBased in Shanghai, Mark Kruger holds Senior Fellow appointments at the Yicai Research Institute, the Centre for International Governance Innovation and University of Alberta’s China Institute. Between 2020 and 2023, Mark was the Opinion Editor at Yicai Global. Previously, he had a 30-year career with the Bank of Canada in the course of which he served as a Senior Advisor to the Canadian Executive Director at the IMF and the head of the Economic and Financial Section of the Canadian Embassy in Beijing.