 Can We Really Believe China’s GDP Numbers?
(Yicai) Dec. 8 -- Notwithstanding some recent weakness, China’s GDP growth looks poised to hit the 5 percent target set by policymakers.
This will be a welcome surprise relative to expectations earlier this year. Given the US’s imposition of punishing tariffs and the ongoing downturn in the domestic property market, the economists surveyed by Reuters in January saw China’s growth slowing to 4.5 percent from the 5 percent recorded in 2024. Indeed, as recently as its Octobre 2025 World Economic Outlook, the IMF projected 4.8 percent growth this year.
This better-than-expected outturn, in the face of such significant headwinds, has led some to question the veracity of China’s GDP data. For example, in “The growing problem with China’s unreliable numbers”, the Financial Times suggested that questions around the accuracy of China’s GDP data have become “more acute”.
For decades, economists have debated the quality of China’s GDP numbers. In 2001, Thomas Rawski published a paper that claimed that China’s “true” GDP growth was only one-third as rapid as the authorities claimed. In contrast, Carsten Holz, who reviewed the data and the processes that the National Bureau of Statistics used, countered that “… one is hard pressed to find evidence of data falsification.”
Compiling national income accounts is a daunting task. Only a small subset of the data that statisticians use is actually “countable” – examples include fiscal revenue and expenses and the trade numbers tracked by customs officials. Most of the data that goes into constructing GDP is estimated from surveys. In addition, GDP is a value-added concept. To avoid double-counting, statisticians need to have a clear picture of all the inputs that go into the production of final goods and services. Finally, GDP is expressed in real – price adjusted – terms, which means that every good and service has to be matched with its own price deflator.
I want to assess whether or not the NBS has been overstating GDP growth in recent quarters. So, I have developed a GDP proxy that does not rely on official data. At the risk of being a little wonky, let me take you through my calculations.
Building on insights from the Federal Reserve Bank of San Francisco, I start with the data reported by China’s trading partners. It is a good place to begin because these data are countable and they are not compiled by the NBS. Thus, they give an excellent third-party picture of China’s international trade.
I begin by adding up the imports from China reported by 102 countries that consistently provided such data over the period 2012Q1 to 2025Q2. I then make two adjustments.
First, I eliminate the effect of price movements by converting the imports to real terms. Ideally, each one of the 102 reporting countries would have a deflator for its purchases from China. Unfortunately, few countries publish this sort of detailed information. I have to compromise here and I rely on the US’s price index for its imports from China to deflate the aggregate data from the 102 countries.
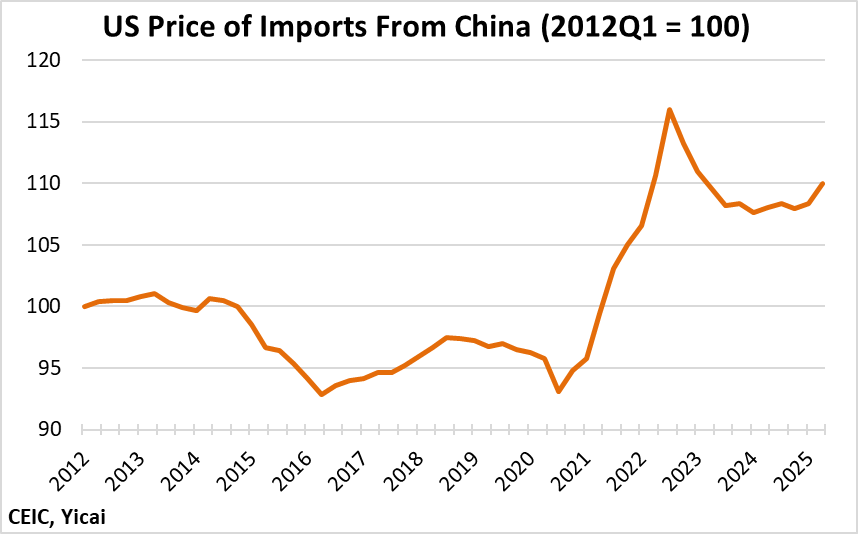
Figure 1 shows the evolution of the prices that US importers paid for Chinese goods. They declined modestly between 2012 and 2020 before rising rapidly during the Covid period. They have fallen from their 2022Q3 peak but remain some 10 percent higher than over 2012-14. Deflating by this price means that some of the sharp increase in imports from China during the Covid period will be eliminated and not enter into our GDP calculation.
Figure 1
Then I correct the data for seasonality. Global imports from China are highly seasonal, with values in the first two quarters typically much lower than those in the second two.
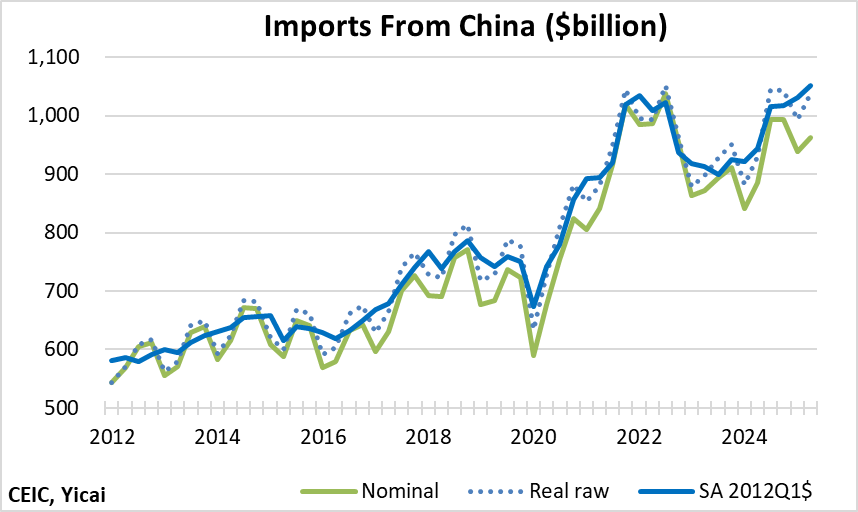
Figure 2 shows the three versions of imports from China: the original nominal data reported by the 102 countries, the real raw values after deflating by the US import price index and the seasonally adjusted real series in terms of 2012Q1 dollars.
Figure 2
I have a somewhat smaller set of countries – 94 – that consistently provide data for their sales to China over the 2012Q1 – 2025Q2 period. I do not think that is problematic because the major countries are accounted for.
A difficulty arises in getting a deflator for these exports. The US does provide a price for its exports to China, but the series only begins in 2018. To work around this, I jerry-rig an export deflator by estimating the relationship between the price of the US’s exports to China and the price of its overall exports. I then run this relationship back to 2012. I also adjust this series for seasonality.
I expect that both imports from China and exports to China will be positively correlated to China’s GDP growth, with the former series telling something about China’s goods exports and the latter about China’s industrial demand. What I am missing is a variable to stand in for services. Here I turn to the privately produced purchasing managers index for China’s service sector.
A PMI is a survey of companies, which asks how business conditions currently appear compared to the previous month. They are diffusion indices, with a reading above 50 indicating an increase and below 50 a decrease in service sector activity.
The NBS produces a PMI series for services that begins in 2007. The privately produced service PMI is even more venerable. IHS Markit, a financial information company, began compiling a Chinese services PMI in 2005 under the sponsorship of the Hongkong and Shanghai Banking Corporation.
In 2015, Caixin Media took over sponsorship of the China PMIs from HSBC. IHS Markit continued to compile the data, which remained comparable to the pre-2015 series.
In 2022, S&P acquired IHS Markit and continued to compile the PMI.
In July 2025, Caixin concluded its sponsorship of the China PMIs, and the rights were acquired by Shenzhen-based RatingDog.
The China Services PMI continues to be compiled by S&P, which surveys purchasing managers in more than 40 countries. The China Services PMI is based on questionnaires sent to some 650 service sector companies in the consumer, transport, information, communication, finance, insurance, real estate and business services sectors.
Since it is produced in China, it does not appear that the private China Services PMI is as arms-length from the Chinese authorities as the import and export data compiled by China’s trading partners. It is, in theory, possible that the Chinese authorities could pressure the private PMI compilers to produce “good news” data. However, looking at the official and private service PMI series side-by-side, it is clear that the two measures are far from identical (Figure 3).
Figure 3
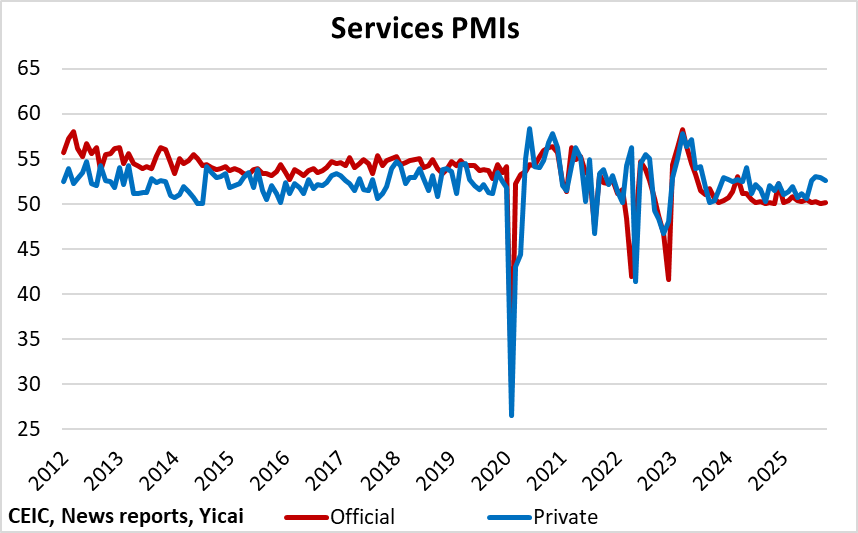
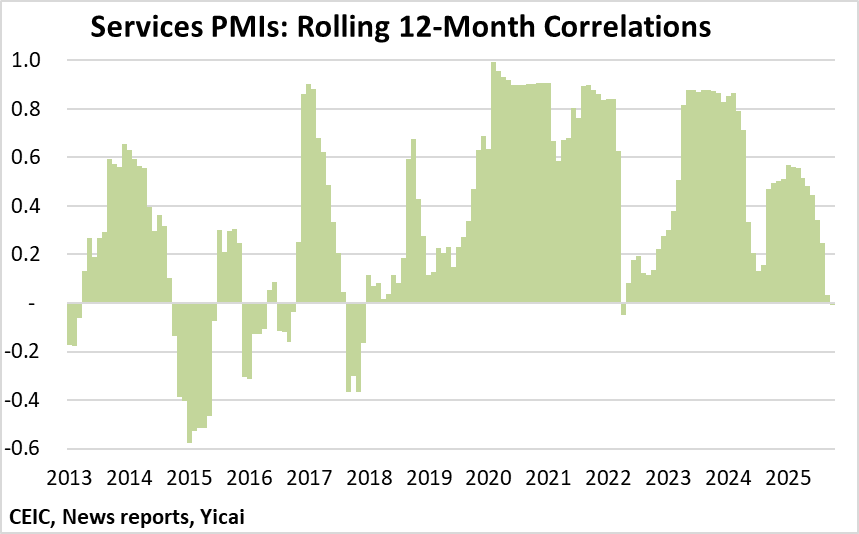
Figure 4 shows the rolling 12-month correlations between the two PMI series. There are some times – for example, during the sharp Covid-induced slowdown in 2020 – during which the correlation between the two series is high. At other times, however, the correlation is negative. Over the last 12 months, the correlation has essentially been zero.
The proxy uses the quarterly average of the monthly private services PMI readings.
Figure 4
Armed with our series of imports from China, exports to China and the private services PMI, we can estimate a relationship with GDP.
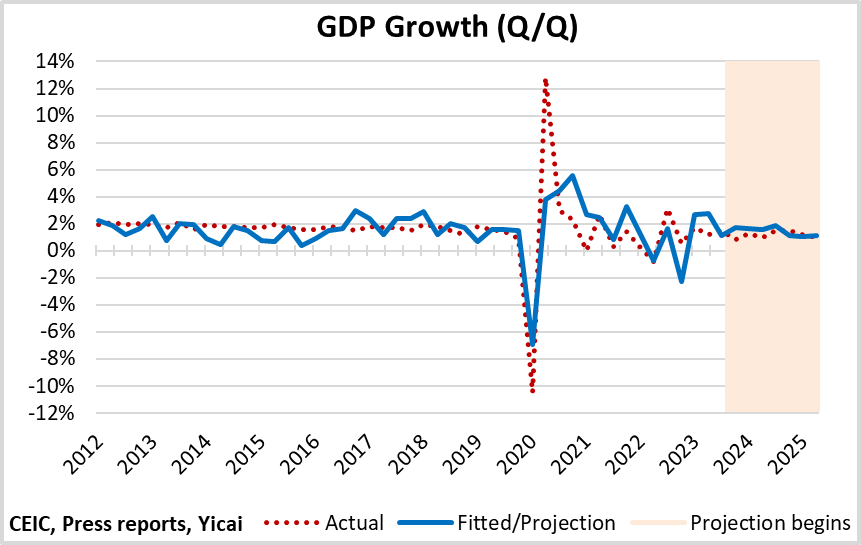
The GDP measure we use here is the quarter-over-quarter percent change that the NBS reports with every national accounts release. We choose this GDP measure rather than the more popular year-over-year statistic because the PMI data are reported in terms of monthly changes and this information could get washed out in a year-over-year comparison.
We estimate the proxy over the 2012Q1 to 2023Q4 period. Figure 5 compares the fitted values of the proxy with the actual GDP growth rates reported by the NBS. Between 2012 and 2017, the proxy’s fitted values indicate slower growth than the NBS’s series. Moreover, its quarterly values are much more volatile. Between 2017 and 2019, the proxy’s fitted values track the NBS’s numbers better. The NBS’s GDP data show greater volatility than the proxy during the Covid period.
Over the full estimation period, the average annual growth rate of the proxy is 6.3 percent, which is identical to that of the NBS’s measure. This, however, is a feature of the ordinary least squares estimation procedure.
The real test of the proxy comes during the 2024Q1 - 2025Q2 projection period. Here, we take the parameters estimated over 2012Q1 - 2023Q4 and see how well the proxy performs out of sample. If the true rate of GDP growth were well below the 5 percent the NBS publishes, then we should see that reflected in the proxy, which depends on third-party data.
As the highlighted portion of Figure 5 shows, the NBS’s numbers do not lie above the values projected for the proxy. In fact, average annual growth reported by the NBS over these six quarters was 5.1 percent, slightly lower than the proxy’s 5.7 percent.
Figure 5
This proxy is not especially well-suited to forecast GDP, as the trade data released by China’s trading parters often come out after the national accounts are released. Nevertheless, based the private PMI through November and the sub-sample of trade data released through 2025Q3, our proxy continues to suggest GDP growth in excess of 5 percent for 2025 as a whole.
I have always been skeptical of the feasibility of the NBS’s systematically overstating GDP growth. Policymakers need to know how the economy is actually performing.
To dispel the lack of confidence around its data, the NBS could be more transparent about the many choices it has to make in coming up with China’s GDP numbers. In the meantime, benchmarking its figures against credible third-party sources provides a useful check.
 Mark KrugerBased in Shanghai, Mark Kruger holds Senior Fellow appointments at the Yicai Research Institute, the Centre for International Governance Innovation and University of Alberta’s China Institute. Between 2020 and 2023, Mark was the Opinion Editor at Yicai Global. Previously, he had a 30-year career with the Bank of Canada in the course of which he served as a Senior Advisor to the Canadian Executive Director at the IMF and the head of the Economic and Financial Section of the Canadian Embassy in Beijing.