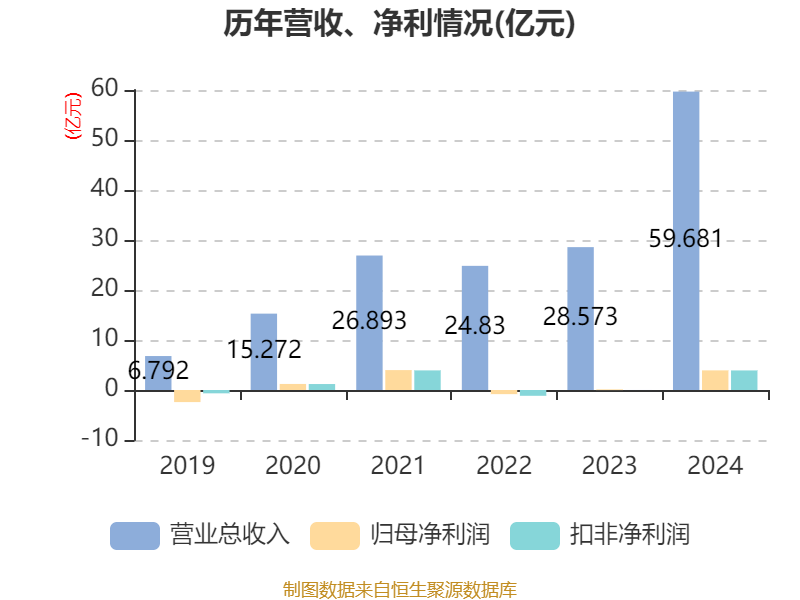
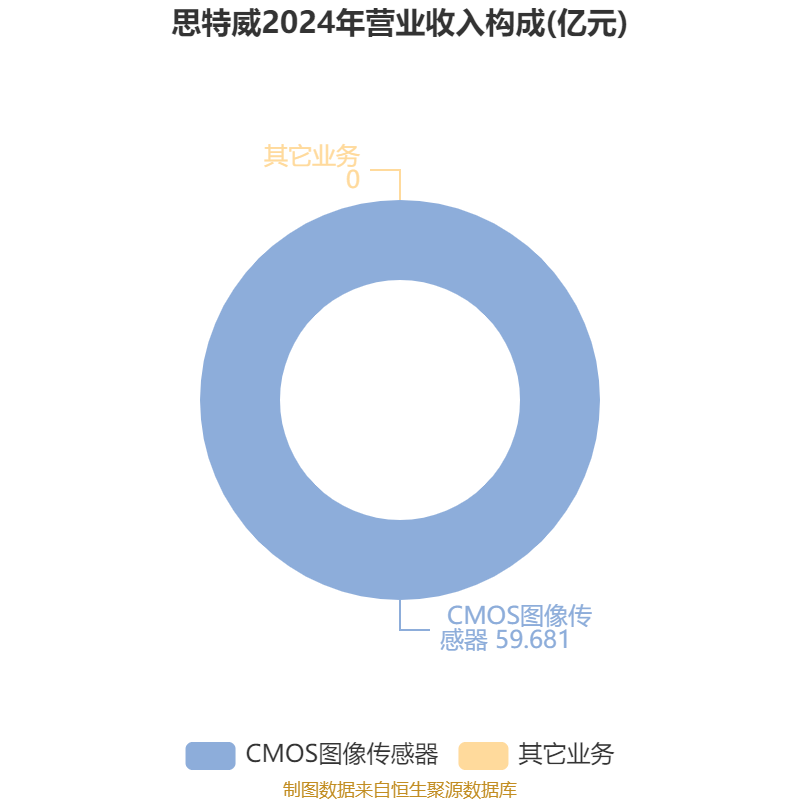
China Securities Intelligent Financial News Smartway (688213) disclosed its 2024 annual report on April 19. In 2024, the company will achieve a total operating income of 5.968 billion yuan, a year-on-year increase of 108.87%; the net profit attributable to the parent company was 393 million yuan, a year-on-year increase of 2662.76%; deducted non-net profit of 391 million yuan, a year-on-year increase of 64,342.63%; the net cash flow from operating activities was 374 million yuan, down 51.19% year-on-year; During the reporting period, SmartSens' basic earnings per share was 0.98 yuan, and the weighted average return on equity was 9.89%. The company's 2024 annual distribution plan is: it is planned to distribute 1.5 yuan (tax included) to all shareholders for every 10 shares.

Based on the closing price on April 18, SmartSens currently has a price-to-earnings ratio (TTM) of about 97.82 times, a price-to-book ratio (LF) of about 9.17 times, and a price-to-sales ratio (TTM) of about 6.44 times.


According to the data, the company's main business is the research and development, design and sales of high-performance CMOS image sensor chips.


According to the data, the company's weighted average return on equity in 2024 will be 9.89%, an increase of 9.51 percentage points from the same period last year. The company's return on invested capital in 2024 will be 7.56%, an increase of 7.18 percentage points from the same period last year.


As of 2024, the company's net cash flow from operating activities will be 374 million yuan, a year-on-year decrease of 51.19%; Net cash flow from financing activities was $642 million, an increase of $892 million year-on-year, and net cash flow from investing activities was -$510 million, compared to -$617 million in the same period last year.


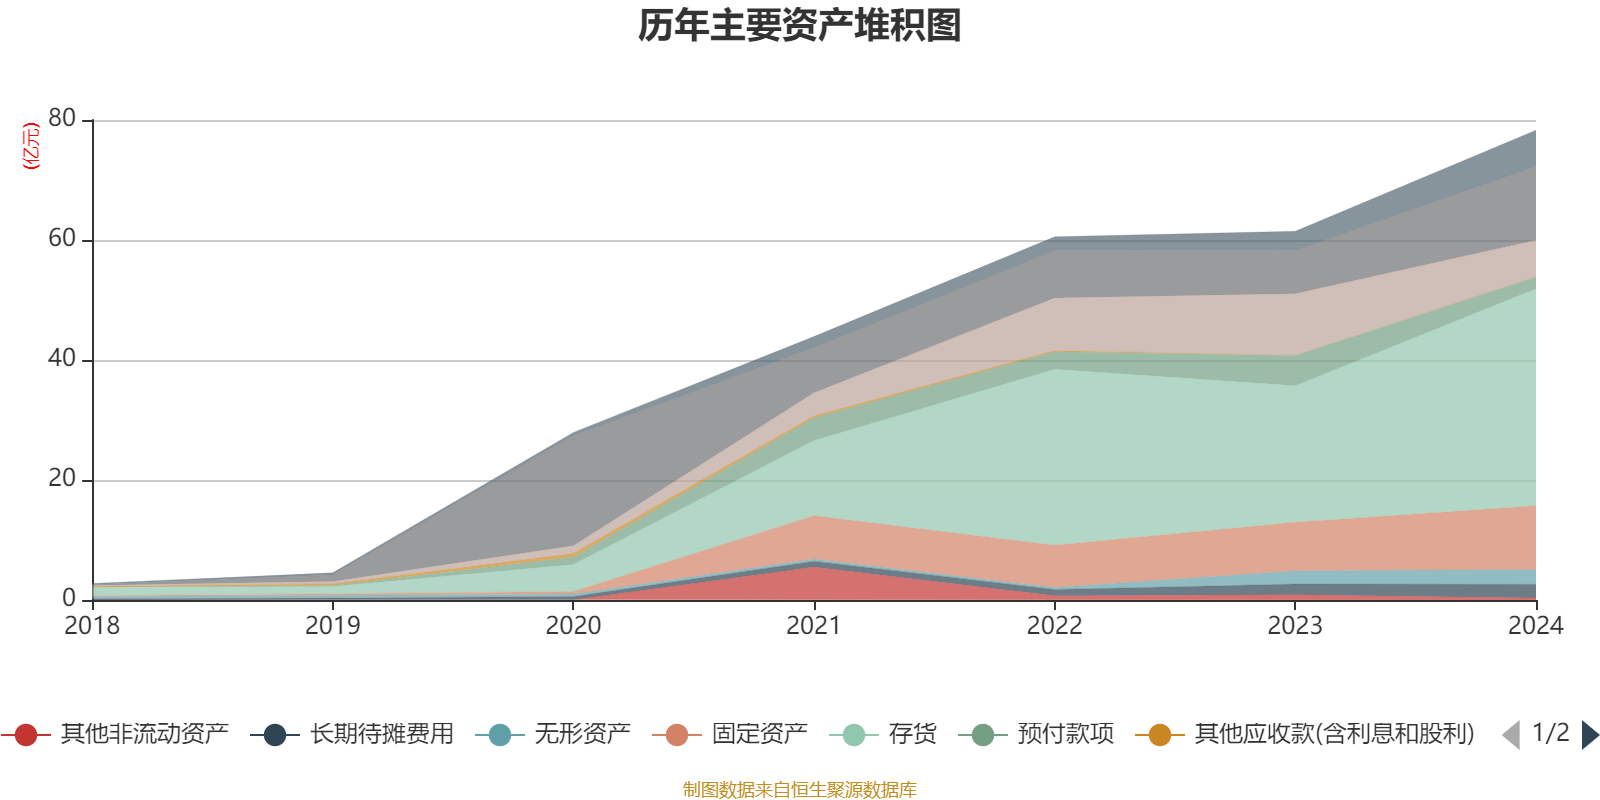
In terms of major changes in assets, as of the end of 2024, the company's inventory increased by 58.98% from the end of the previous year, accounting for 9.17 percentage points of the company's total assets, notes receivable and accounts receivable decreased by 40.61% from the end of the previous year, accounting for 8.91 percentage points of the company's total assets, prepayments decreased by 61.73% from the end of the previous year, accounting for 5.73 percentage points of the company's total assets, and monetary funds increased by 70.83% from the end of the previous year. The proportion of the company's total assets increased by 3.98 percentage points.
In terms of major changes in liabilities, as of the end of 2024, the company's long-term borrowings increased by 100.87% from the end of the previous year, accounting for 2.42 percentage points of the company's total assets, contract liabilities increased by 188.95% from the end of the previous year, accounting for 1.88 percentage points of the company's total assets, short-term borrowings increased by 17.72% from the end of the previous year, accounting for 1.71 percentage points of the company's total assets, and other payables (including interest and dividends) increased by 181.03% from the end of the previous year. The proportion of the company's total assets increased by 1.6 percentage points.

From the perspective of inventory changes, as of the end of 2024, the book value of the company's inventory was 3.618 billion yuan, accounting for 86.38% of net assets, an increase of 1.342 billion yuan from the end of the previous year. Among them, the provision for inventory decline was 143 million yuan, and the provision ratio was 3.79%.


For the whole year of 2024, the company's R&D investment will be 447 million yuan, a year-on-year increase of 56.35%; R&D investment accounted for 7.5% of operating income, down 2.51 percentage points from the same period last year.


In 2024, the company has a current ratio of 1.95 and a quick ratio of 0.77.


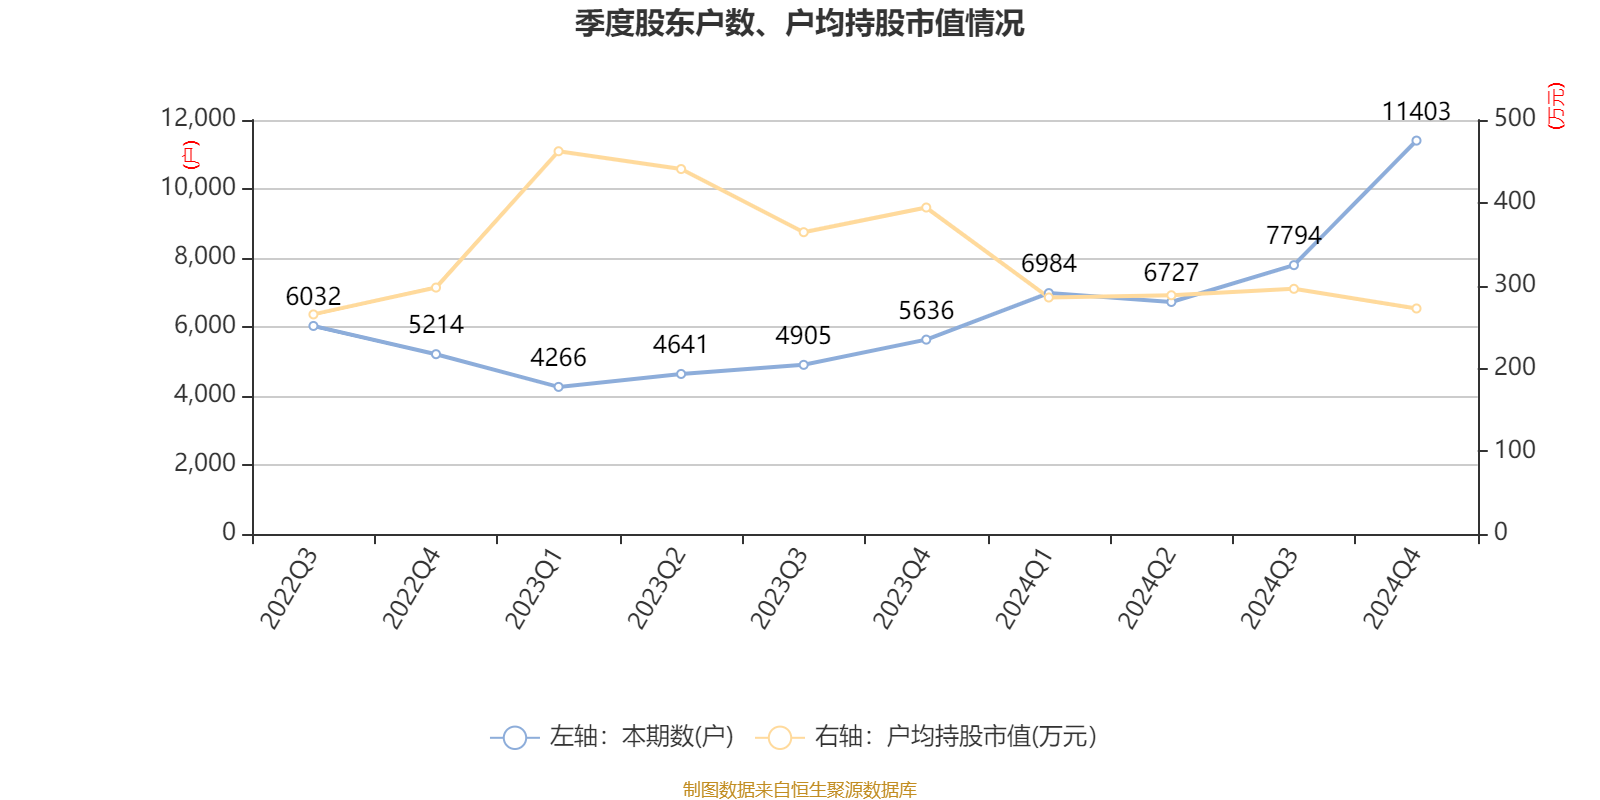
According to the annual report, among the top ten circulating shareholders of the company at the end of 2024, the new shareholders are Harvest SSE Science and Technology Innovation Board Chip Trading Open-ended Index Securities Investment Fund, Invesco Great Wall Research Selected Equity Securities Investment Fund, Invesco Great Wall Fund China Life Growth Equity Portfolio Single Asset Management Plan (available for sale), replacing Jiangsu Zhaoyin Industrial Fund Management Co., Ltd. - Nanjing Zhenyuan No. 2 Equity Investment Partnership (Limited Partnership), Zhejiang Dahua Technology Co., Ltd., SmartSens Holdings Limited. In terms of specific shareholding ratio, Huaxin Investment Management Co., Ltd. - National Integrated Circuit Industry Investment Fund Phase II Co., Ltd., Brizan China Holdings Limited, Gongqingcheng Sizhiwei Technology Industry Investment Partnership (Limited Partnership), Ma Weijian, Hubble Ventures Co., Limited have increased their shareholdings, Forebright Smart Eyes Technology Limited, Invesco Great Wall Electronic Information Industry Equity Securities Investment Fund holdings declined.
| name | Number of outstanding shares held (10,000 shares) | to total share capital (%) | , change ratio (percentage points): |
|---|---|---|---|
| Huaxin Investment Management Co., Ltd. - National Integrated Circuit Industry Investment Fund II Co., Ltd | .2954.36 | 7.3912 | 0.006 |
| Brizan China Holdings Limited | 2340.22 | 5.8547 | 0.004 |
| Gongqingcheng Sizhiwei Technology Industry Investment Partnership (Limited Partnership) | 1717.04 | 4.2957 | 0.003 |
| Ma Weijian | 1640.48 | 4.1041 | 0.003 |
| Forebright Smart Eyes Technology Limited | 1601.21 | 4.0059-0.994 | |
| Hubble Ventures Co., Limited | 791.26 | 1.9795 | 0.002Harvest |
| SSE Science and Technology Innovation Board Chip Exchange-traded Open-ended Index Securities Investment Fund | 602.92 | 1.5083 | New entrant |
| Invesco Great Wall Research Select Equity Securities Investment Fund | 486.73 | 1.2177 | New |
| Induction Invesco Great Wall Fund China Life Growth Equity Portfolio Single Asset Management Plan (Available for Sale) | 427.14 | 1.0686 | New Entry |
| Invesco Great Wall Electronic Information Industry Equity Securities Investment Fund | 423.45 | 1.0593-0.469 |
Proofreading: Shen Nan
Indicator Annotation:
P/E ratio = total market capitalization / net profit. When the company loses money, the P/E ratio is negative, and it is not practical to use the P/E ratio for valuation, and the P/B ratio or P/B ratio is often used as a reference.
Price-to-book ratio = total market capitalization / net assets. The price-to-book ratio valuation method is mostly used for companies with large fluctuations in earnings and relatively stable net assets.
Price-to-sales ratio = total market capitalization / operating income. The price-to-sales ratio method is often used for growing companies that are losing money or making small profits.
The price-to-earnings ratio and price-to-sales ratio in this article are calculated using the TTM method, that is, the data for the 12 months up to the latest financial report (including forecast). The price-to-book ratio is calculated using the LF method, that is, based on the latest financial report data. The quantile calculation range of the three is from the company's listing to the latest announcement date.
When the P/E ratio and price-to-book ratio are negative, the current quantile is not displayed, which will cause the line chart to be interrupted.
Ticker Name
Percentage Change
Inclusion Date