China Securities Intelligent Financial News Anji Technology (688019) disclosed its 2024 annual report on April 16. In 2024, the company will achieve a total operating income of 1.835 billion yuan, a year-on-year increase of 48.24%; the net profit attributable to the parent company was 534 million yuan, a year-on-year increase of 32.51%; deducted non-net profit of 526 million yuan, a year-on-year increase of 63.44%; the net cash flow from operating activities was 493 million yuan, a year-on-year increase of 46.69%; During the reporting period, Anji Technology's basic earnings per share was 4.14 yuan, and the weighted average return on equity was 22.18%. The company's 2024 annual distribution plan is: it is planned to transfer 3 shares for every 10 shares to all shareholders, and distribute 4.5 yuan (tax included).

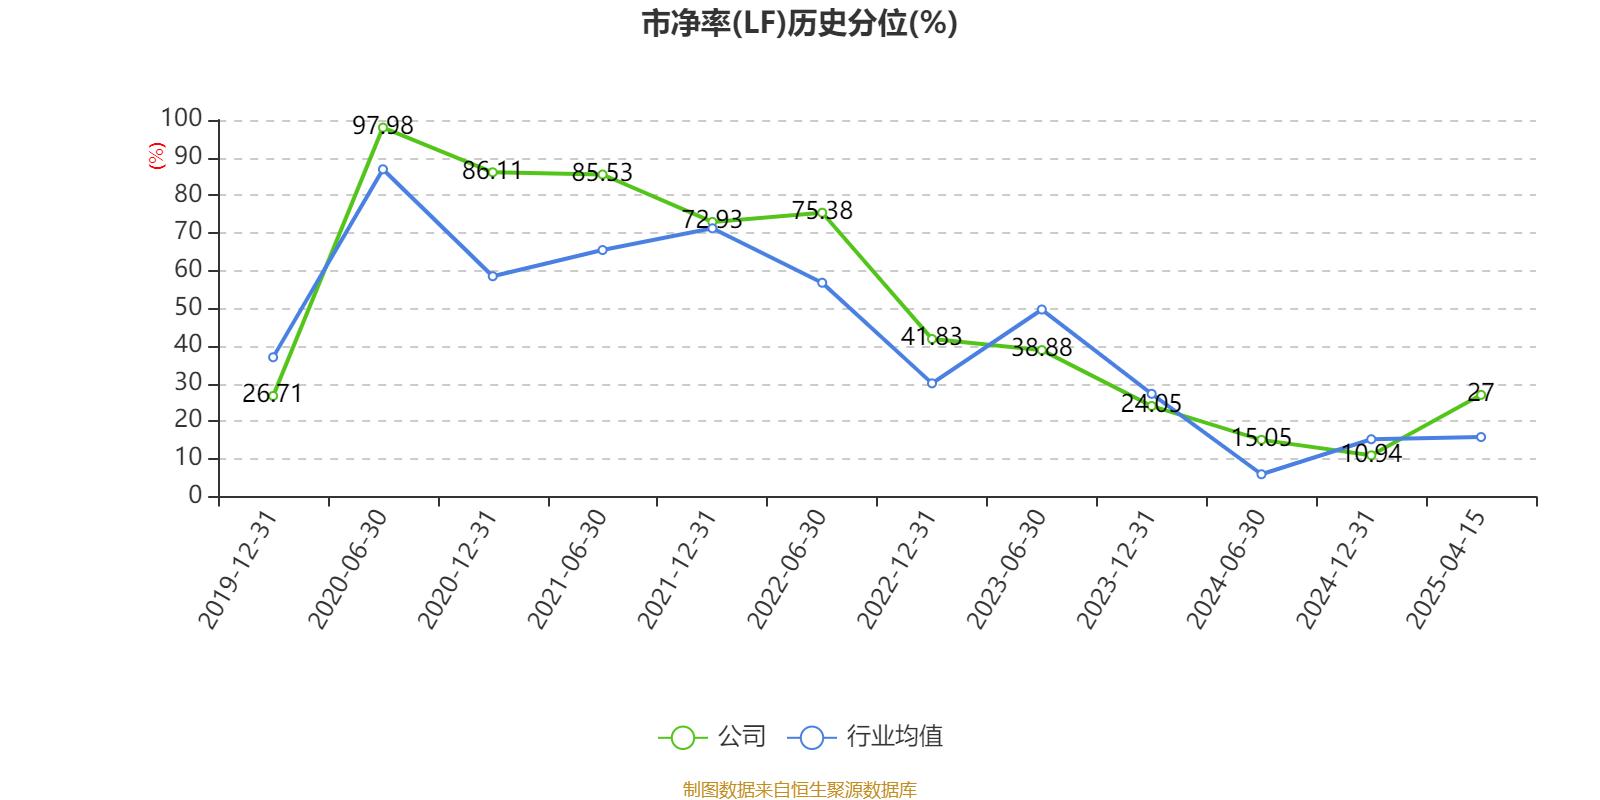
Based on the closing price on April 15, Anji Technology's current price-to-earnings ratio (TTM) is about 41.03 times, the price-to-book ratio (LF) is about 8.11 times, and the price-to-sales ratio (TTM) is about 11.93 times.


According to the data, the company's main products are chemical mechanical polishing slurries, functional wet electronic chemicals, electroplating solutions and additives.


According to the data, the company's weighted average return on equity in 2024 will be 22.18%, an increase of 0.71 percentage points from the same period last year. The company's return on invested capital in 2024 will be 19.13%, down 0.73 percentage points from the same period last year.


As of 2024, the company's net cash flow from operating activities will be 493 million yuan, a year-on-year increase of 46.69%; The net cash flow from financing activities was 123 million yuan, a decrease of 51.4707 million yuan year-on-year, and the net cash flow from investment activities was -352 million yuan, compared with -316 million yuan in the same period last year.


In terms of major changes in assets, as of the end of 2024, the company's monetary funds increased by 68.73% from the end of the previous year, accounting for 5.57 percentage points of the company's total assets, fixed assets increased by 65.91% from the end of the previous year, accounting for 2.98 percentage points of the company's total assets, other non-current assets decreased by 53.31% from the end of the previous year, accounting for 2.4 percentage points of the company's total assets, and the total number of projects under construction decreased by 6.82% from the end of the previous year. The proportion of the company's total assets decreased by 2.04 percentage points.

In terms of major changes in liabilities, as of the end of 2024, the company's short-term borrowings increased by 1218.42% from the end of the previous year, accounting for 3.39 percentage points of the company's total assets, long-term deferred income decreased by 18.01% from the end of the previous year, accounting for 1.5 percentage points of the company's total assets, notes payable and accounts payable increased by 78.04% from the end of the previous year, accounting for 1.06 percentage points of the company's total assets, and leasing liabilities decreased by 0.79% from the end of the previous year. The proportion of the company's total assets decreased by 0.8 percentage points.

From the perspective of inventory changes, as of the end of 2024, the book value of the company's inventory was 618 million yuan, accounting for 22.87% of net assets, an increase of 190 million yuan from the end of the previous year. Among them, the provision for inventory decline was 19.289 million yuan, and the provision ratio was 3.03%.


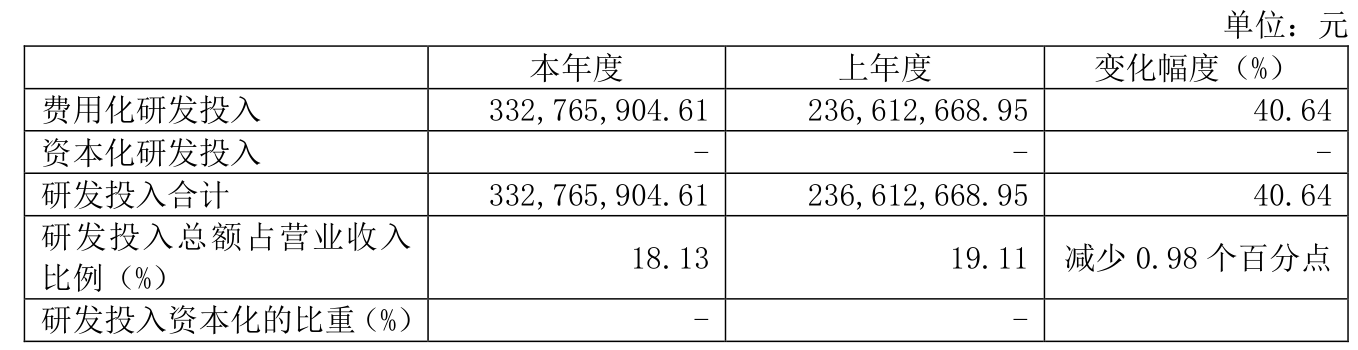
In 2024, the company's R&D investment will be 333 million yuan, a year-on-year increase of 40.64%; R&D investment accounted for 18.13% of operating income, down 0.98 percentage points from the same period last year.


In 2024, the company has a current ratio of 4.34 and a quick ratio of 3.02.


According to the annual report, among the top ten circulating shareholders of the company at the end of 2024, the new shareholders are Harvest SSE Science and Technology Innovation Board Chip Trading Open-ended Index Securities Investment Fund and Southern Information Innovation Hybrid Securities Investment Fund, replacing the National Integrated Circuit Industry Investment Fund Co., Ltd. and Guolianan CSI All-Index Semiconductor Products and Equipment Trading Open-ended Index Securities Investment Fund at the end of the third quarter. In terms of specific shareholding ratios, the holdings of the National Social Security Fund 110 Portfolio have increased, and the holdings of Hong Kong Securities Clearing Co., Ltd., Invesco Great Wall Fund China Life Growth Equity Portfolio Single Asset Management Plan (available for sale), Shanghai Dachen Technology Investment Co., Ltd., Invesco Great Wall Electronic Information Industry Equity Securities Investment Fund, Invesco Great Wall Growth Leading One-year Holding Period Hybrid Securities Investment Fund, and Invesco Great Wall Research Selected Equity Securities Investment Fund have declined.
| name | Number of outstanding shares (10,000 shares) | to total share capital (%) | , change ratio (percentage points): |
|---|---|---|---|
| Anji Microelectronics Co., Ltd | 3981.09 | 30.8102 | unchanged |
| Hong Kong Securities Clearing Company Limited | 492.48 | 3.8113-0.817 | |
| Invesco Great Wall Fund China Life Growth Equity Portfolio Single Asset Management Plan (available for sale). | 259.09 | 2.0051-0.151 | |
| Shanghai Dachen Technology Investment Co., Ltd. | 225.7 | 1.7467-0.039 | |
| Invesco Great Wall Electronic Information Industry Equity Securities Investment Fund | 210.49 | 1.629-0.766 | |
| Harvest SSE Science and Technology Innovation Board Chip Exchange-traded Open-ended Index Securities Investment Fund | 195.03 | 1.5093 | New National |
| Social Security Fund 110 Portfolio | 162.11 | 1.2545 | 0.301 |
| Southern Information Innovation Hybrid Securities Investment Fund | 149.65 | 1.1581 | New |
| Invesco Great Wall Growth Leading One-year Holding Period Hybrid Securities Investment Fund | 118.91 | 0.9202 | -0.090 |
| Invesco Great Wall Research Select Equity Securities Investment Fund | 110.83 | 0.8576-0.437 |

Proofreading: Shen Nan
Indicator Annotation:
P/E ratio = total market capitalization / net profit. When the company loses money, the P/E ratio is negative, and it is not practical to use the P/E ratio for valuation, and the P/B ratio or P/B ratio is often used as a reference.
Price-to-book ratio = total market capitalization / net assets. The price-to-book ratio valuation method is mostly used for companies with large fluctuations in earnings and relatively stable net assets.
Price-to-sales ratio = total market capitalization / operating income. The price-to-sales ratio method is often used for growing companies that are losing money or making small profits.
The price-to-earnings ratio and price-to-sales ratio in this article are calculated using the TTM method, that is, the data for the 12 months up to the latest financial report (including forecast). The price-to-book ratio is calculated using the LF method, that is, based on the latest financial report data. The quantile calculation range of the three is from the company's listing to the latest announcement date.
When the P/E ratio and price-to-book ratio are negative, the current quantile is not displayed, which will cause the line chart to be interrupted.
Ticker Name
Percentage Change
Inclusion Date