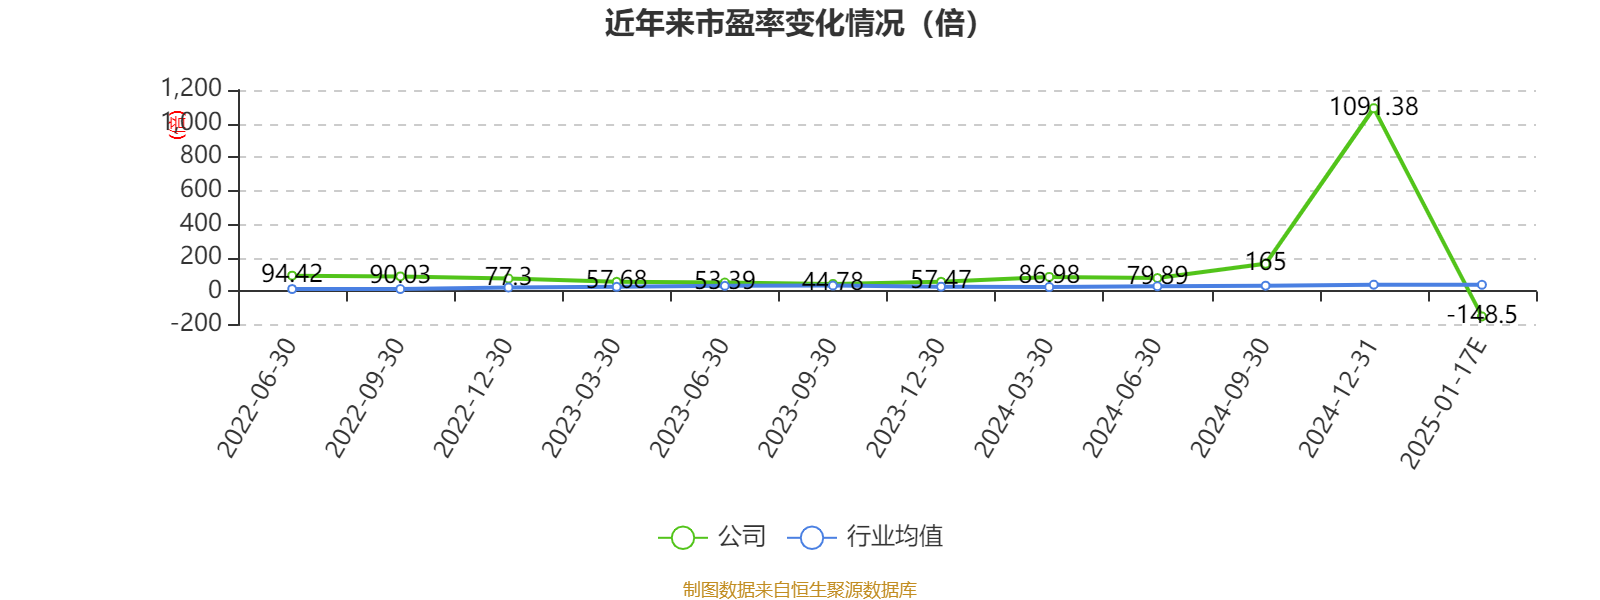
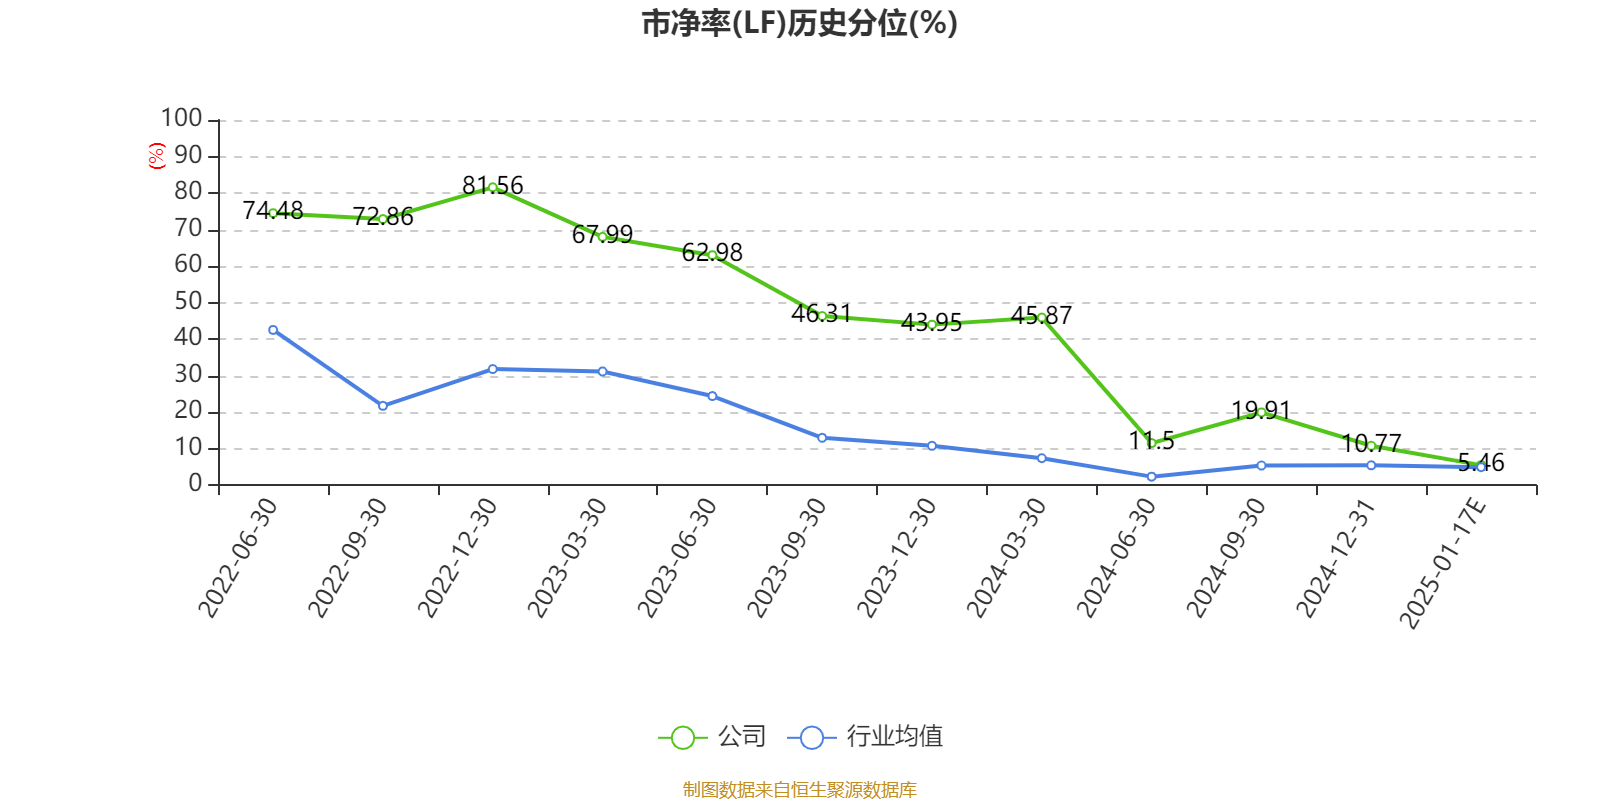
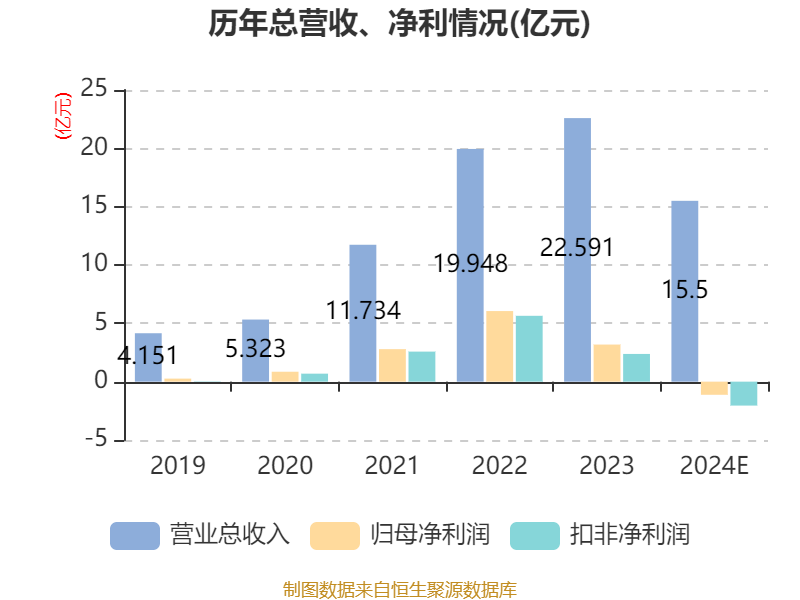
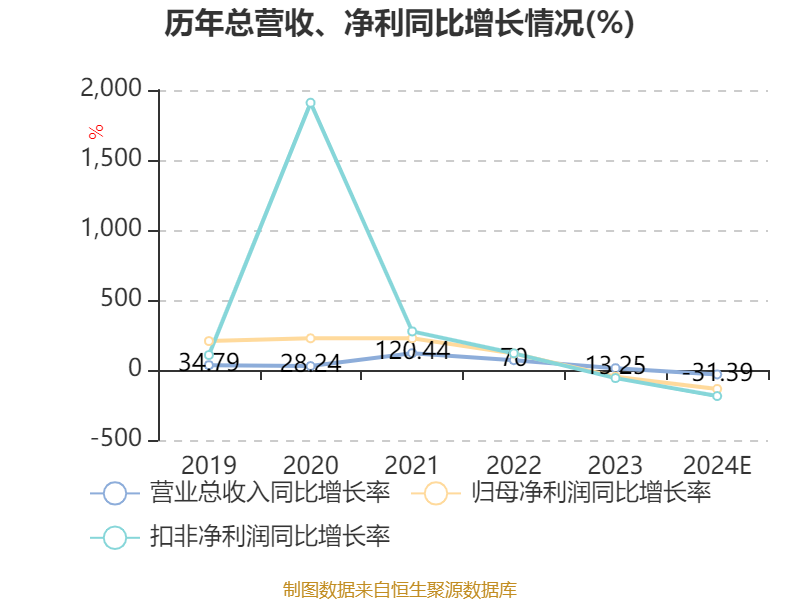
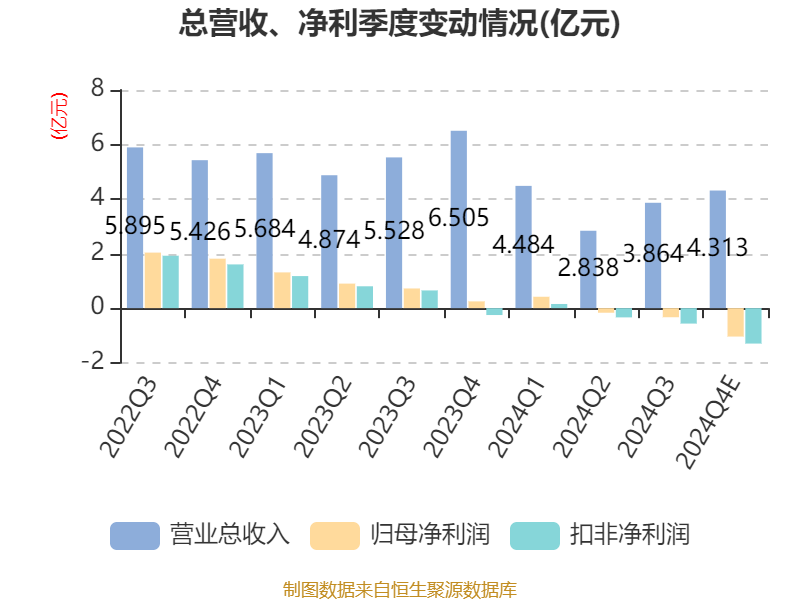
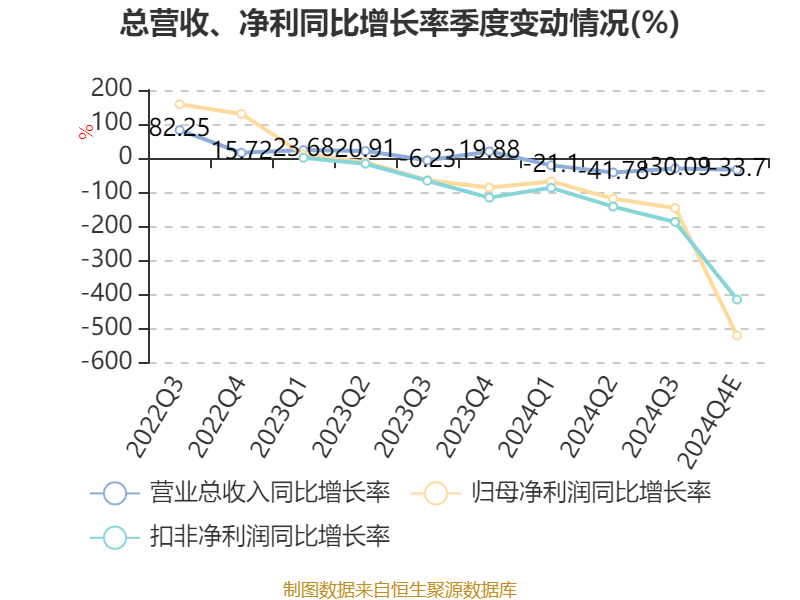
China Securities Intelligent Financial News Zhongfu Shenying (688295) disclosed its 2024 annual performance forecast on the evening of January 17, and it is expected to achieve operating income of 1.5 billion yuan to 1.6 billion yuan in 2024, a year-on-year decrease of 29.18%-33.6%; The net profit loss attributable to the parent company was 90 million yuan to 135 million yuan, compared with a profit of 318 million yuan in the same period last year, and the non-net profit loss was 170 million yuan to 240 million yuan, compared with a profit of 238 million yuan in the same period last year. Based on the closing price on January 17, the current price-to-earnings ratio (TTM) of Zhongfu Shenying is about -118.8 times to -178.2 times, the price-to-book ratio (LF) is about 3.38 times, and the price-to-sales ratio (TTM) is about 10.35 times.
Based on the average value of this disclosed performance forecast, the company's price-to-earnings ratio (TTM) chart in recent years is as follows
:

According to the announcement, the reason for the change in the company's performance is that during the reporting period, affected by the imbalance between supply and demand in the carbon fiber industry, the downstream demand is less than expected and the continuous decline in product sales prices, the operating income, net profit attributable to shareholders of listed companies, net profit attributable to shareholders of listed companies after deducting non-recurring gains and losses and basic earnings per share and other financial indicators decreased significantly compared with the same period last year.
Based on the principle of prudence, combined with the judgment of market conditions and the requirements of accounting standards, provision for impairment is made for some assets with signs of impairment. In addition, the company's wholly-owned subsidiaries, Zhongfu Shenying Carbon Fiber Xining Co., Ltd. and Zhongfu Shenying (Shanghai) Technology Co., Ltd., were fully put into operation, and the capitalization of project loans increased to expense, which had a certain impact on the company's net profit.
Proofreading: Sun Ping
Indicator Annotation:
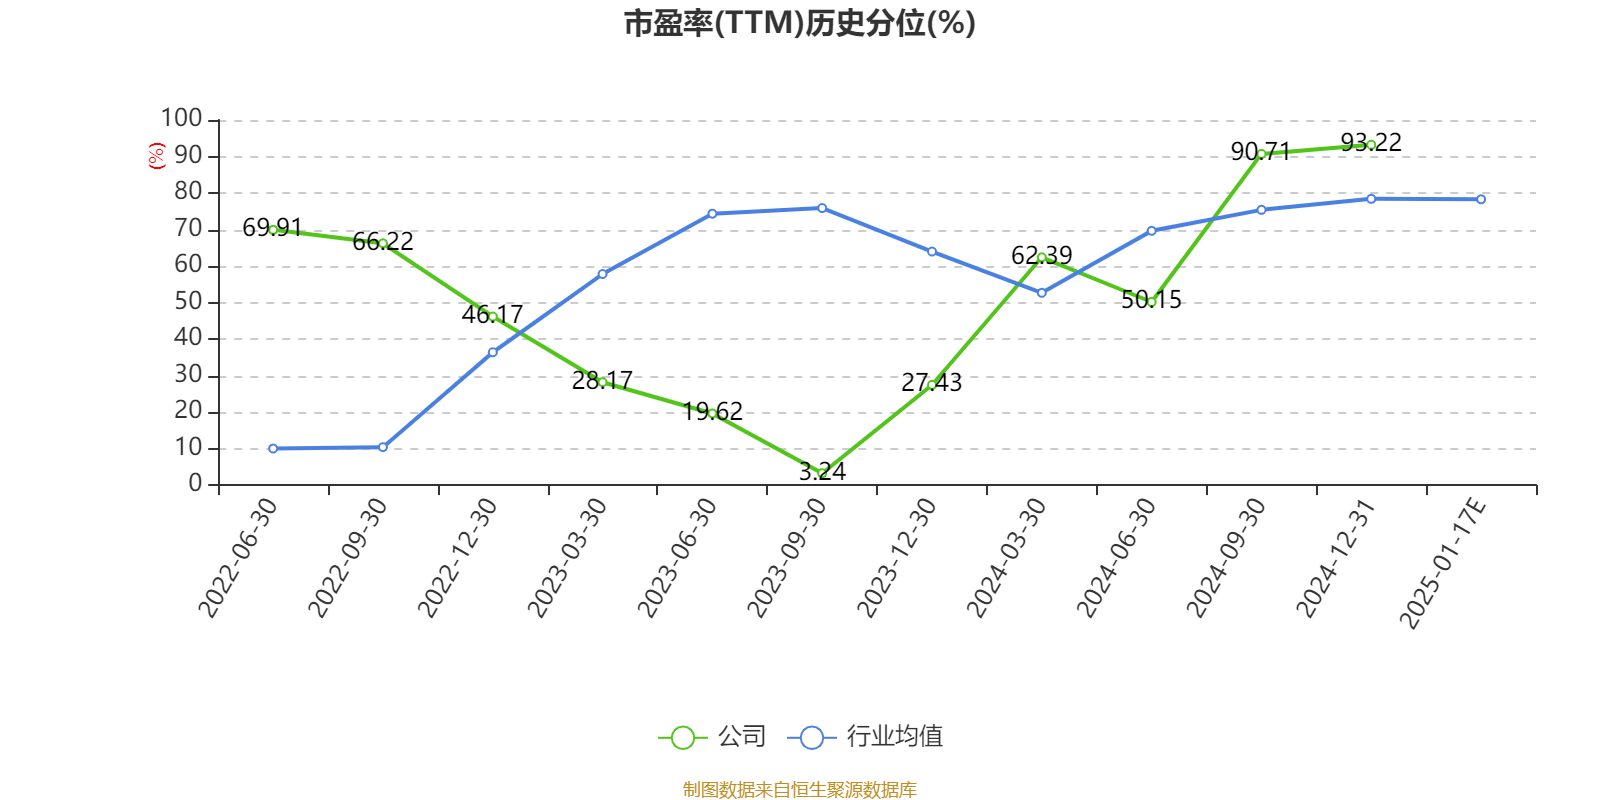
P/E ratio = total market capitalization / net profit. When the company loses money, the P/E ratio is negative, and it is not practical to use the P/E ratio for valuation, and the P/B ratio or P/B ratio is often used as a reference.
Price-to-book ratio = total market capitalization / net assets. The price-to-book ratio valuation method is mostly used for companies with large fluctuations in earnings and relatively stable net assets.
Price-to-sales ratio = total market capitalization / operating income. The price-to-sales ratio method is often used for growing companies that are losing money or making small profits.
The price-to-earnings ratio and price-to-sales ratio in this article are calculated using the TTM method, that is, the data for the 12 months up to the latest financial report (including forecast). The price-to-book ratio is calculated using the LF method, that is, based on the latest financial report data. The quantile calculation range of the three is from the company's listing to the latest announcement date.
When the P/E ratio and price-to-book ratio are negative, the current quantile is not displayed, which will cause the line chart to be interrupted.
Ticker Name
Percentage Change
Inclusion Date