 China’s Place in Shifting Global Supply Chains
(Yicai) Jan. 12 -- As we look out into the new year, one of the key uncertainties is how well the global trading system will hold up. While there are concerns that geopolitical pressures will lead to the fracturing of supply chains and deglobalization, I think there are reasons to be hopeful that we will continue to reap the benefits of integrated international trade.
First of all, despite all of the rhetoric, international trade has remained robust. Figure 1 shows the trends in the volumes of goods and services trade and GDP over the last three decades (the 2023 data point is the IMF’s estimate from its October WEO). While the trade-to-GDP ratio has plateaued, trade volumes last year were expected to be 8 percent higher than their pre-pandemic peak.
Figure 1

Global trade’s robust performance in these challenging geopolitical times can be favourably compared to the interwar period when globalization really did go into reverse. Data presented by the IMF show that exports plus imports fell from some 35 percent of global GDP in the mid-1920s to 25 percent in the early 1930s.
In other good news, policymakers appear to be somewhat less protectionist.
Global Trade Alert tracks policy interventions which affect international trade in goods and services and cross-border investment. In 2020-2022, it recorded more than 4800 “harmful” interventions per year, on average (Figure 2). This was up sharply from 2800 such interventions, on average, between 2019 and 2009.
The recent spike likely resulted from the dislocation caused by the pandemic. It is encouraging that these harmful interventions fell below 3000 last year, as Covid became much less virulent and policymakers felt less inclined to protect domestic markets.
Figure 2

Global Trade Alert also tracks “liberalizing” interventions across the same three dimensions (Figure 3). There typically have been about five times as many harmful as liberalizing interventions. But that ratio appears to be shrinking. In 2020-2022, there were, on average, about 70 percent more liberalizing interventions than over 2009-2019 (the same percent increase as for the harmful interventions). However, while harmful interventions fell off considerably last year, policymakers continued to make significant liberalizing interventions, about 60 percent more than the 2009-19 average.
We shouldn’t underestimate the benefits of a less protectionist policy environment for the global economy. Economists at KOF, a Swiss research institute, provide compelling econometric evidence that institutional liberalization, rather than greater economic flows, is what matters in supporting per capita GDP growth.
Figure 3

Research by Freund and co-authors show that despite protectionist policies, deglobalization in the US is limited to a subset of US-China trade. Notwithstanding the tariffs imposed by the Trump Administration in 2018-19, the trade data show that overall US openness to the world remains intact. The US’s goods imports in the 12 months to November 2023 were 24 percent higher than in the year to December 2019 (Figure 4). According to the authors, deglobalization and reshoring have not yet been significant in the US at the aggregate level.
Figure 4

Nevertheless, the tariffs the US imposed on Chinese imports have led to a significant decoupling. On a 12-month rolling sum basis, China’s share of the US’s goods imports fell from a peak of 22 percent in early 2018 to 14 percent in November 2023. By looking at US imports on a very disaggregated basis (the 10-digit HS product level), Freund and co-authors find that the fall in China’s market share was not generalized across all import categories. Rather, it was concentrated in those goods that were subject to the US’s tariffs. This means the China-US decoupling is policy-induced rather than market-led.
Freund and co-authors also find that the countries that increased their exports to the US in these product lines also tightened their supply linkages with China. This was especially true of those goods in so-called “strategic sectors” (i.e. those the US government lists as Advanced Technology Products). Thus, while the US has shifted its imports away from China in strategic sectors, it may not have reduced its dependence on China as much as the trade data suggest.
This conclusion is echoed by innovative firm-level research undertaken by Qiu and co-authors in a recent edition of the BIS Bulletin. These researchers rely on two snapshots of supplier-customer linkage data taken in December 2021 and September 2023, respectively.
Their methodology allows the researchers to map out the indirect linkages between manufacturing firms. Qiu and co-authors find that there has been an increase in the “network firm distance” between Chinese suppliers and their US customers. It appears that firms elsewhere in the Asia Pacific region have interposed themselves in the China-US supply chain, taking up a greater share of the value added. This effect is most pronounced in the IT industry, where direct China-US connections have given way to links via other Asian countries.
The trade data reinforce the message that China is becoming a more important player in regional supply chains.
Table 1 shows that between the 12 months ending December 2017 and the year to September 2023, China’s share of the US’s imports fell by 7.5 percentage points. Over the same time, its import share in the four biggest ASEAN countries rose by 4.0 percentage points. Most notably, China increased its share of Vietnam’s imports by more than 7 percentage points. Of the four biggest ASEAN countries, Vietnam saw the largest increase in its exports to the US (Figure 5).
While China’s share of the world’s imports slipped from 13.7 to 13.2 percent, this decline is fully attributable to its performance in the US. Excluding the US, China’s share of the rest of the world’s imports rose by 0.6 percentage points. Note that despite the tariff-induced decline in China’s share of US imports, the US remains more dependent on China than the rest of the world (14.0 percent vs. 13.1 percent).
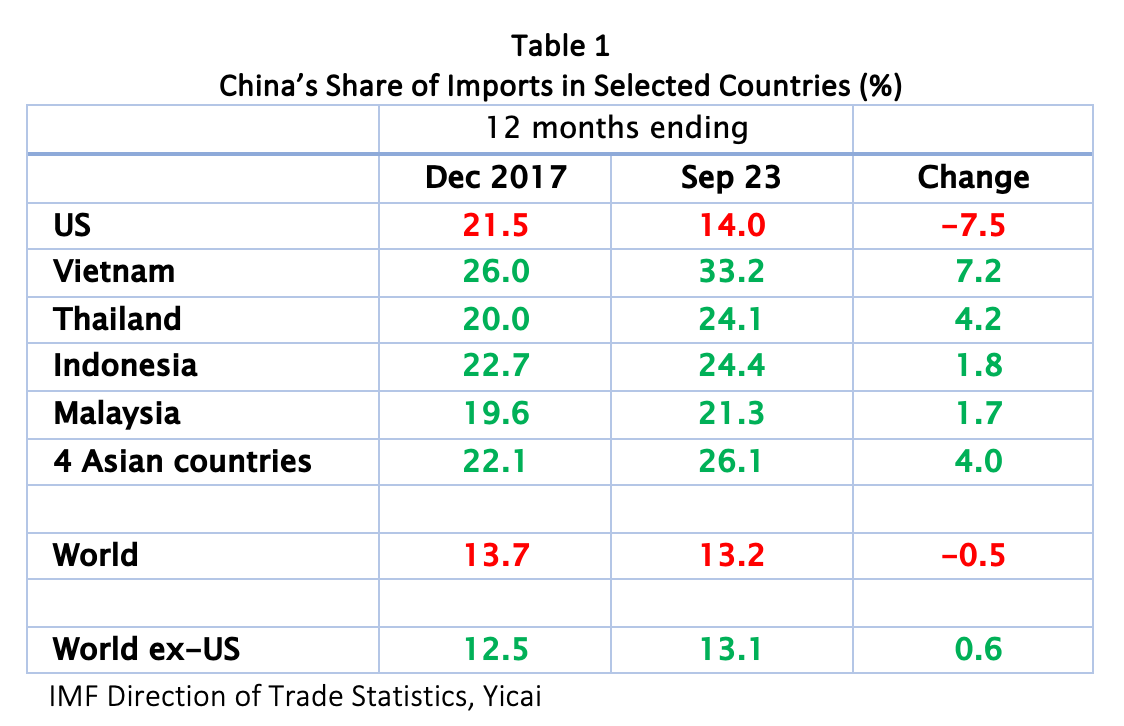
Figure 5

To summarize, there has been no wholesale reversal of globalization. That’s a good thing because specialization and trade are forces that make the world, in aggregate, richer.
Trade policy matters. While policymakers, in general, became less protectionist last year, the US’s tariffs continue to have significant negative effects both at home and abroad.
From China’s perspective, the tariffs have encouraged its firms to lengthen their supply chains and tighten relationships with their Asian neighbours. China is a founding member of the Regional Comprehensive Economic Partnership, the world’s largest regional trade agreement, which came into effect two years ago. As a result, Chinese firms find themselves well prepared for this phase of globalization.
 Mark KrugerMark Kruger is Yicai Global's Opinion Editor and Senior fellow to the Yicai Research Institute. He is also a Senior Fellow at both the University of Alberta's China Institute and the Centre for International Governance Innovation. Mark was formerly a Senior Policy Director in the Bank of Canada's International Department, a Senior Advisor to the Canadian Executive Director at the International Monetary Fund and head of the Economic and Financial Section in the Canadian Embassy in Beijing.